
- Title
-
First In Vivo Insights on the Effects of Tempol-Methoxycinnamate, a New UV Filter, as Alternative to Octyl Methoxycinnamate, on Zebrafish Early Development
- Authors
- Damiani, E., Sella, F., Astolfi, P., Galeazzi, R., Carnevali, O., Maradonna, F.
- Source
- Full text @ Int. J. Mol. Sci.
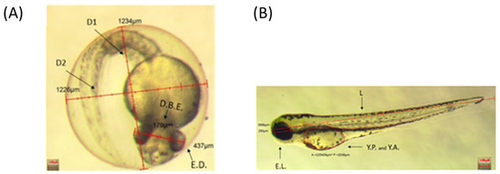
Inserts show a representative 48 hpf embryo (A) and 72 hpf larva (B), displaying the analyzed parameters. D1: Eye Diameter 1; D2: Eye Diameter 2; D.B.E.: Distance between eyes; E.D.: Eye diameter; E.L.: Eye length; Y.P.: Yolk perimeters; Y.A.: Yolk area; L: body length. Scale bar 100 µm. |
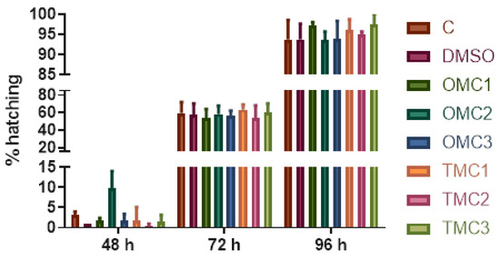
Hatching rate in experimental embryos/larvae at 48, 72, and 96 hpf. |
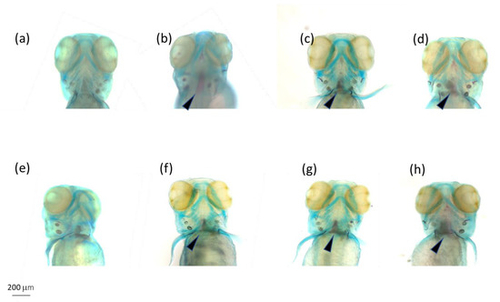
Alcian blue–Alizarin red double staining of the head skeleton (dorsal view) of 96 hpf larvae. (a) CTRL; (b) OMC1; (c) OMC2; (d) OMC3; (e) DMSO; (f) TMC1; (g) TMC2; (h) TMC3 (1 = 0.05 mM, 2 = 0.01 mM, and 3 = 0.005 mM). Arrows indicate the basioccipital articulatory process (BOP). Scale bar = 200 mm. |
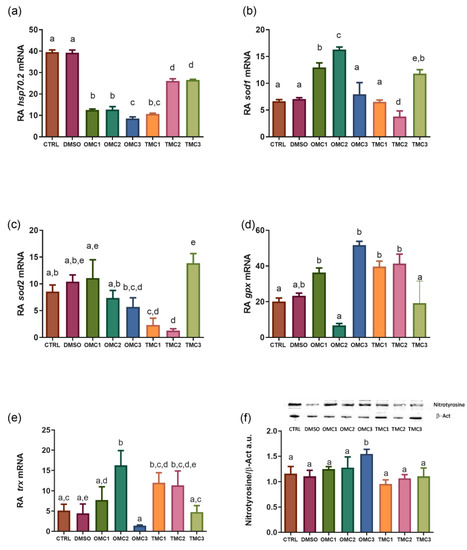
Expression profiles of oxidative stress response biomarkers. (a) hsp70, (b) sod1, (c) sod2, (d) gpx, and (e) trx mRNA and (f) Nitrotyrosine protein levels in larvae exposed to the different experimental treatments. mRNA levels were normalized against rplp0 and rplp13 and used as reference genes. Nitrotyrosine levels were normalized against β-actin. Insert shows representative nitrotyrosine (55 KDa) and b-Act (42 KDa) immunoblots. Data are shown as the mean ± SD. Different letters indicate statistically significant differences among the experimental groups (p < 0.05). |
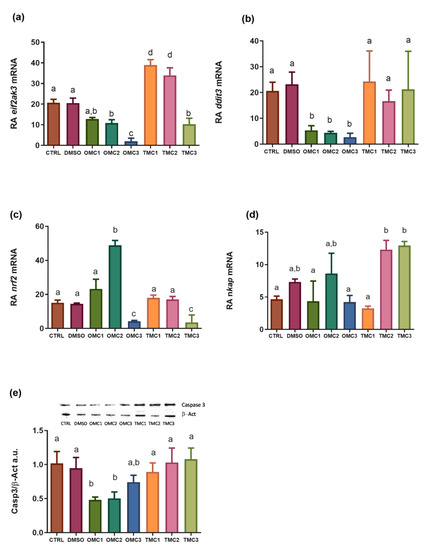
Expression profiles of ER stress biomarkers. (a) eif2ak3, (b) ddit3, (c) nrf2, (d) nkap mRNA, and (e) Casp3 protein levels in larvae exposed to the different experimental treatments. mRNA levels were normalized against rplp0 and rplp13 and used as reference genes. Cleaved caspase 3 (Casp3) (17 KDa) levels were normalized against b-actin (b-Act) (42 KDa). Insert (e) shows representative Casp3 and β-Act blots. Data are shown as the mean ± SD. Different letters indicate statistically significant differences among the experimental groups (p < 0.05). |
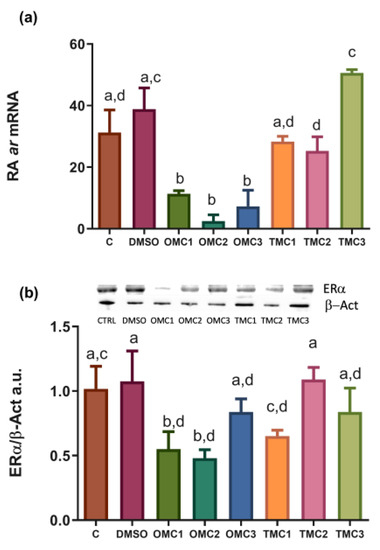
Expression profiles of steroid hormone receptors. (a) ar mRNA and (b) ERα protein levels in larvae exposed to the different experimental treatments. mRNA levels were normalized against rplp0 and rplp13 and used as reference genes. The ERα levels were normalized against β-actin (β-Act). Insert (b) shows representative ERα (65 KDa) and β-Act (42 KDa) blots. Data are shown as the mean ± SD. Different letters indicate statistically significant differences among experimental groups (p < 0.05). |
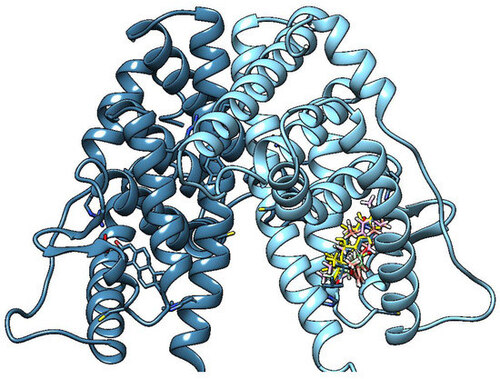
TMC clusters 1–3 (most relevant and significatively populated, tube/sticks model) in the binding cleft of the dimeric estrogen receptor ligand binding domain (LBD) (light blue, chain A/deep blue, chain B) (binding in only one monomer is shown). Estradiol is represented as a yellow tube model. |
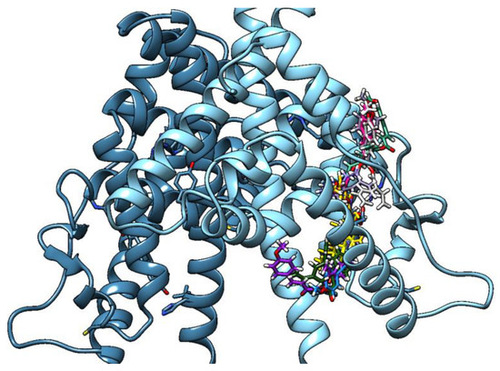
OMC clusters 1–9 (most relevant and significatively populated, tube models) in the binding cleft of the dimeric estrogen receptor LBD (light blue, chain A/deep blue, chain B ribbons) (binding in only one monomer is shown). Estradiol is represented as yellow tubes. |
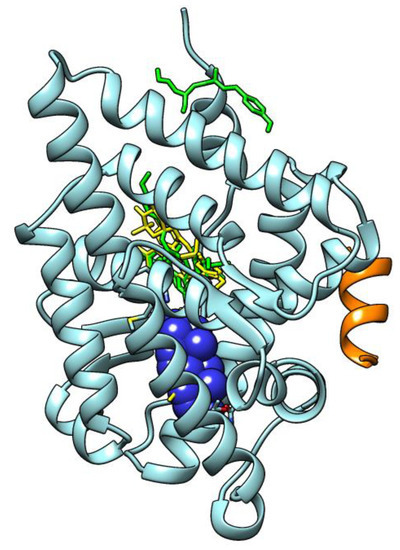
Androgen receptor LBD (cyan, ribbons) in a complex with DHT (dihydrotestosterone, in blue, CPK sphere) and its peptidic coactivator (orange, ribbons); in green tubes, OMC poses; in yellow tubes, TMC ones. |
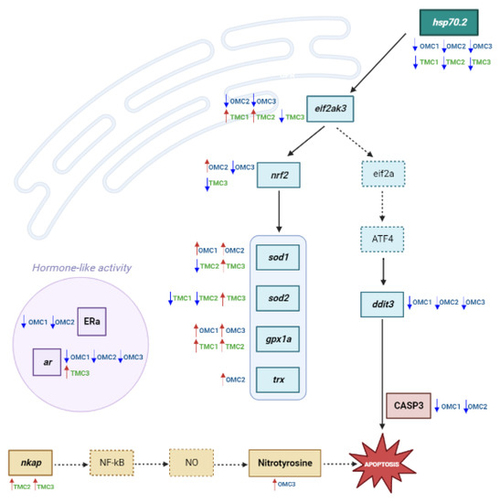
Graph chart showing the analyzed biomarkers’ network. Analyzed targets are marked in bold within boxes, while those in dotted boxes were not analyzed. Arrows indicate significantly increased (⬆) or decreased (⬇) levels/expression with respect to the control ones. eif2a, Eukaryotic translation initiation factor 2A; ATF4, Activating Transcription Factor 4; NO, nitric oxide. |