
Image
|
Figure Caption
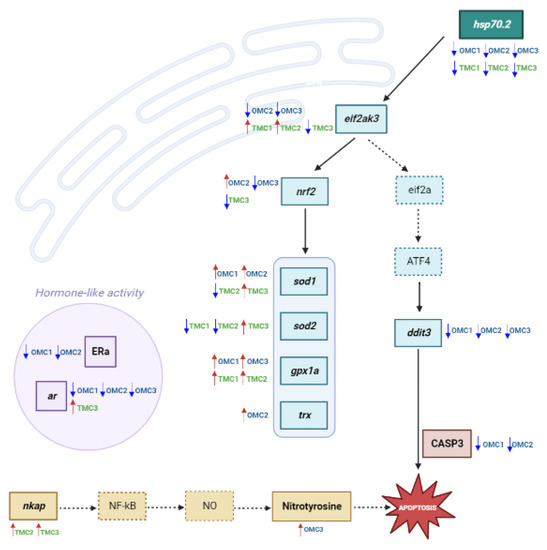
Fig. 10 Graph chart showing the analyzed biomarkers’ network. Analyzed targets are marked in bold within boxes, while those in dotted boxes were not analyzed. Arrows indicate significantly increased (⬆) or decreased (⬇) levels/expression with respect to the control ones. eif2a, Eukaryotic translation initiation factor 2A; ATF4, Activating Transcription Factor 4; NO, nitric oxide.
Acknowledgments
This image is the copyrighted work of the attributed author or publisher, and
ZFIN has permission only to display this image to its users.
Additional permissions should be obtained from the applicable author or publisher of the image.
Full text @ Int. J. Mol. Sci.