FIGURE SUMMARY
Title

A p21-GFP zebrafish model of senescence for rapid testing of senolytics in vivo

Authors
Morsli, S., Henriques, C.M., Ellis, P.S., Mortiboys, H., Baxendale, S., Loynes, C.A., Renshaw, S.A., Bellantuono, I.
Source
Full text @ Aging Cell

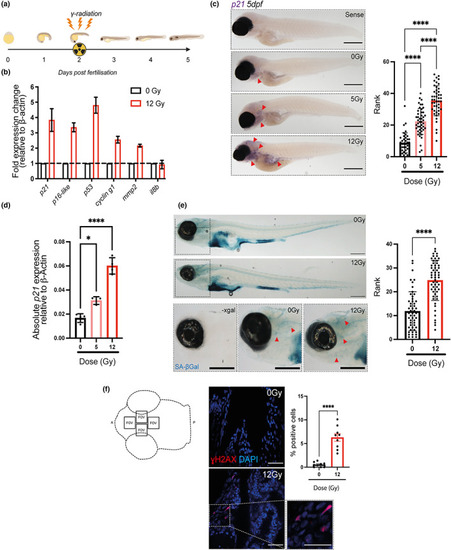
Irradiation of zebrafish larvae upregulates multiple markers of senescence. (a) Diagram depicting the experimental protocol used to induce senescence in zebrafish larvae using Cs137 ɣ‐Irradiation at 2 dpf and assessing markers of senescence at 5 dpf. (b) Quantitative PCR (qPCR) of whole zebrafish mRNA at 5 dpf following 12 Gy irradiation to determine gene expression of p21 (cdkn1a), p16‐like (cdkn2a/b), p53, cyclin‐g1, mmp2 and IL8b. Fold expression was calculated by 2−ΔCt relative to β‐actin. mRNA was pooled from 50 zebrafish for each independent repeat. The graph represents the mean ± SEM of 3 repeats. (c) Transmitted light photomicrographs of a whole‐mount in situ hybridisation (WISH) for p21 (cdkn1a) mRNA expression at 5 dpf following 5 or 12 Gy irradiation at 2 dpf (left panels). Areas of increased staining include pharyngeal arches, brain and intestine, depicted with red arrows. Scale 250 μm. Quantification of ISH photomicrographs through blind ranking such that fish with the strongest staining are ranked highest (right panel). Data were examined by Kruskal–Wallis test with Dunn's multiple comparisons (N = 45). (d) Quantitative qPCR of whole zebrafish mRNA at 5 dpf following irradiation at 5 and 12 Gy to determine expression of p21. Data expressed as expression relative to GAPDH and analysed by one‐way ANOVA and Sidak's multiple comparisons test. (e) Photomicrographs of zebrafish at 5 dpf stained for senescence‐associated β‐Galactosidase (SA‐βGal) activity. Representative examples of the head region are also displayed on the left. Scale 200 μm (Left panels). Quantification of SA‐βGal activity in the head region by blind ranking is on the left (n = 55) (right panel). Data were examined by Kruskal–Wallis test with Dunn's multiple comparisons (f) Confocal fluorescence photomicrographs (Scale 25 μm) and quantification of ɣH2AX immunofluorescence in the ventral zebrafish head regions (areas depicted in the cartoon in the left panel) a minimum of 600 cells/fish were counted. For each fish, 4 fields of view and 3 individual z planes, 10 μM apart were analysed. At least 9 fish were analysed across three independent repeats. Data represented as mean ± SEM (N = 9) and examined by unpaired t‐test. Significant differences displayed as **p < 0.01; ****p < 0.0001. a, Anterior; p, posterior; FOV, field of view.

Zebrafish larvae showed reduced muscle fibre thickness and mobility following irradiation. (a) Representative photomicrographs of haematoxylin and eosin (H&E) staining of zebrafish muscle from either 12 dpf larvae with and without irradiation (top left panel), and middle aged and geriatric adults (bottom left panel) (scale 25 μm) and quantification of muscle fibre thickness in larvae following irradiation and in middle aged (18 months) and geriatric zebrafish (>36 months) (right panels). Data shown as mean ± SEM. Each dot represents an animal. (b) Representative example of distance travelled by zebrafish over 30 min in a 24‐well plate at 5 (N ≥ 47) and 12 dpf (N ≥ 23) following 0 Gy or 12 Gy irradiation administered at 2 dpf and quantitation of the distance travelled at 5 and 12 dpf. Each dot represents an animal. Data examined by unpaired t‐test. ****p < 0.0001; *p < 0.05.

p21:GFPBright cells are induced with irradiation and ageing in the p21:GFP transgenic zebrafish. (a) Representative confocal fluorescence photomicrographs to depict GFP fluorescence of 5 dpf p21:GFP zebrafish following 0 Gy or 12 Gy irradiation at 2 dpf (Scale 500 μm) and quantification of fluorescence intensity of the whole p21:GFP transgenic zebrafish. Each dot represents an animal. Graph represents Mean ± SEM and data were examined by Mann–Whitney test. (b) Transmitted and wide‐field fluorescence photomicrographs taken laterally and ventrally showing p21:GFP fluorescence recapitulated endogenous p21 mRNA expression (Scale bar 100 μm). (c) qPCR of whole zebrafish mRNA demonstrating p21 expression in transgenic p21:GFP and wild‐type strain zebrafish, relative to βactin (2−ΔCt). mRNA was pooled from 50 zebrafish for each independent repeat. The graph represents the mean ± SEM of 3 repeats. Data were examined by 2 way ANOVA with Tukey's multiple comparison test. ****p < 0.0001; ***p < 0.001; **p < 0.01 (d) Representative flow cytometry profiles of dissociated 5 dpf p21:GFP zebrafish and wild‐type siblings treated with either 0 Gy or 12 Gy irradiation and quantitation of the proportion of live p21:GFP‐, p21:GFPDim and p21:GFPBright cells in dissociated 5 dpf p21:GFP zebrafish larvae. Dissociated cells from 50 fish were pooled for each repeat (n = 3) (e) Representative flow cytometry profiles of dissociated 12 dpf p21:GFP zebrafish larvae and wild‐type siblings treated with either 0 Gy or 12 Gy irradiation. Quantification of the proportion of live p21:GFP‐, p21:GFPDim and p21:GFPBright cells in dissociated 12 dpf p21:GFP zebrafish larvae. Dissociated cells from 25 fish were pooled for each experiment (n = 3). Data were examined by 2 way ANOVA with Šidak's multiple comparisons test. (f) The proportion of p21:GFPDim, and p21:GFPBright at 18, 28 and at least 36 months (mo) old in adult p21:GFP zebrafish brains, intestines and livers were quantified. Data were examined by one‐way ANOVA with Sidak's multiple comparison test. Data are presented as mean ± SEM. ***p < 0.001, **p < 0.01; *p < 0.05.

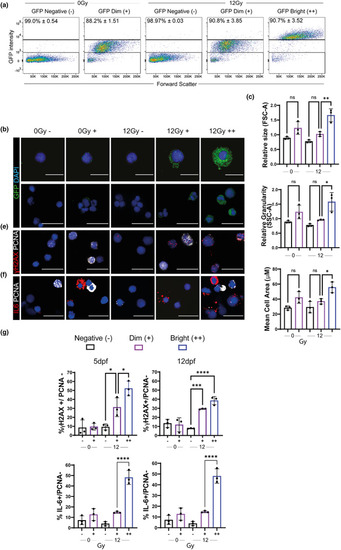
GFPBright cells are associated with other markers of senescence at 5 and 12 dpf. (a) Representative flow cytometry profiles of 5 dpf p21:GFP cells after sort according to GFP intensity. The level of purity of each population across three independent biological replicates is at the top of the graph. (b) Representative confocal fluorescent photomicrographs of immunofluorescence for GFP Scale 10 μm (top), 20 μm (bottom). (c) Quantification of cell size (FSC‐A) and granularity (SSC‐A) in GFPNegative, GFPDim and GFPBright populations, relative to total live cells. (d) Mean cell area quantified by measuring confocal fluorescent photomicrographs of sorted GFPNegative, GFPDim and GFPBright populations. (e,f) Representative confocal fluorescent photomicrographs of immunofluorescence for (e) ɣH2AX and PCNA or (f) IL6 and PCNA in 5 dpf p21:GFP cells, sorted according to GFP intensity. (f) Quantification of the proportion of ɣH2AX +/PCNA– cells (top) and IL6 +/PCNA– cells (bottom) in GFPNegative, GFPDim, and GFPBright populations at 5 dpf (left) and 12 dpf (right). Data were examined by one‐way ANOVA with Sidak's multiple comparisons test. 300 cells quantified for each group over 3 independent experiments. Scale 20 μm. Mean ± SEM represented throughout. ****p < 0.0001; **p < 0.01; *p < 0.05.

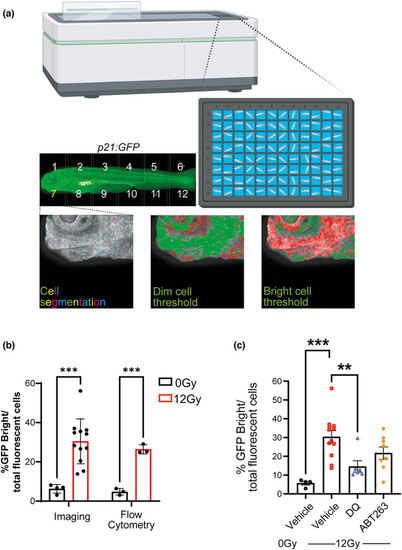
Senolytics reduces the number of p21:GFPBright cells. (a) Diagram representing automated imaging method for p21:GFP zebrafish using The Opera Phenix High‐Content Screening System. Tiled confocal photomicrographs from Opera Phenix microscope of 5 dpf p21:GFP zebrafish were acquired, and individual cells were segregated for analysis. The mean fluorescence intensity of individual cells was classified against a threshold set on the basis of level of fluorescence in wild‐type fish and non‐irradiated p21:GFP fish to identify the GFPBright population; (b) Percentage of GFPBright cells calculated by Opera Phenix High‐Content Imaging and Flow Cytometry analysis, as a proportion of total fluorescent cells in p21:GFP fish with or without irradiation. (c) Quantification of the proportion of GFPBright at 5 dpf in laterally oriented p21:GFP fish following irradiation at 2 dpf and treatment starting at 3 dpf with vehicle, dasatinib (D) plus quercetin (Q) or ABT263 (navitoclax). Data were examined with one‐way ANOVA with Tukey's multiple comparison's test. Data (from two independent experiments are presented as Mean ± SEM presented. ***p < 0.001; **p < 0.01.

Acknowledgments
This image is the copyrighted work of the attributed author or publisher, and ZFIN has permission only to display this image to its users. Additional permissions should be obtained from the applicable author or publisher of the image. Full text @ Aging Cell