IMAGE

FIGURE 4

ID
ZDB-IMAGE-230617-29
Source
Figures for Morsli et al., 2023
Image
Figure Caption

FIGURE 4

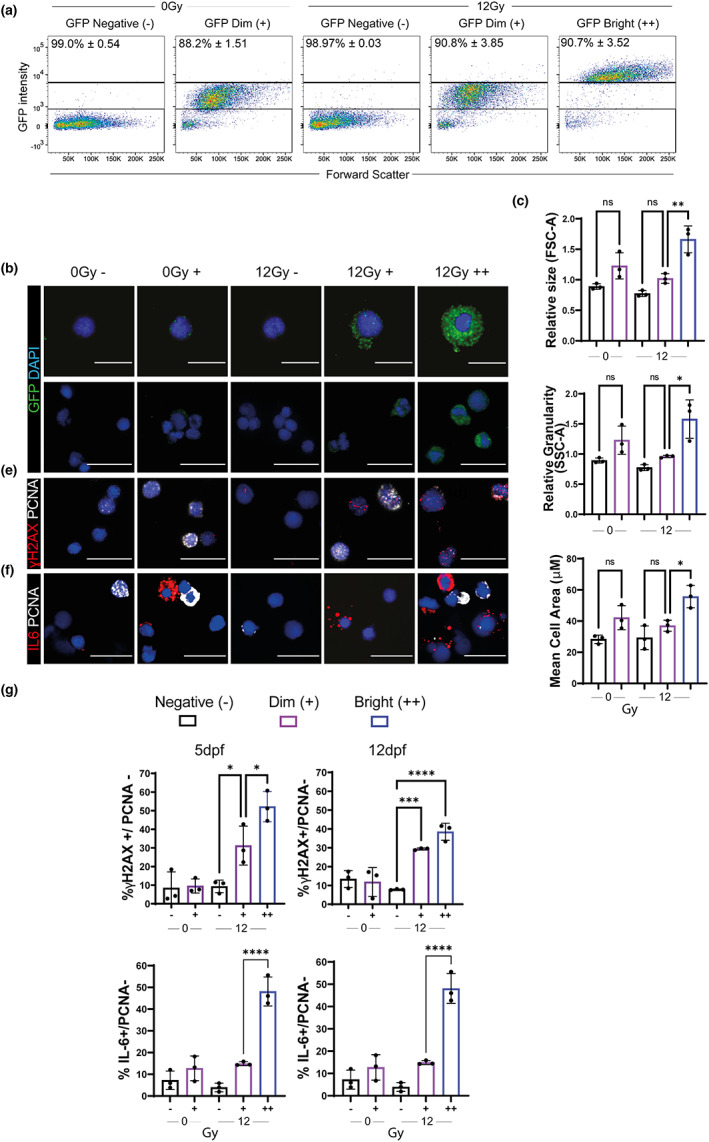
GFPBright cells are associated with other markers of senescence at 5 and 12 dpf. (a) Representative flow cytometry profiles of 5 dpf p21:GFP cells after sort according to GFP intensity. The level of purity of each population across three independent biological replicates is at the top of the graph. (b) Representative confocal fluorescent photomicrographs of immunofluorescence for GFP Scale 10 μm (top), 20 μm (bottom). (c) Quantification of cell size (FSC‐A) and granularity (SSC‐A) in GFPNegative, GFPDim and GFPBright populations, relative to total live cells. (d) Mean cell area quantified by measuring confocal fluorescent photomicrographs of sorted GFPNegative, GFPDim and GFPBright populations. (e,f) Representative confocal fluorescent photomicrographs of immunofluorescence for (e) ɣH2AX and PCNA or (f) IL6 and PCNA in 5 dpf p21:GFP cells, sorted according to GFP intensity. (f) Quantification of the proportion of ɣH2AX +/PCNA– cells (top) and IL6 +/PCNA– cells (bottom) in GFPNegative, GFPDim, and GFPBright populations at 5 dpf (left) and 12 dpf (right). Data were examined by one‐way ANOVA with Sidak's multiple comparisons test. 300 cells quantified for each group over 3 independent experiments. Scale 20 μm. Mean ± SEM represented throughout. ****p < 0.0001; **p < 0.01; *p < 0.05.

Acknowledgments
This image is the copyrighted work of the attributed author or publisher, and ZFIN has permission only to display this image to its users. Additional permissions should be obtained from the applicable author or publisher of the image. Full text @ Aging Cell