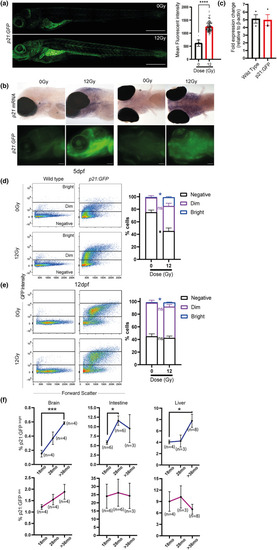
p21:GFPBright cells are induced with irradiation and ageing in the p21:GFP transgenic zebrafish. (a) Representative confocal fluorescence photomicrographs to depict GFP fluorescence of 5 dpf p21:GFP zebrafish following 0 Gy or 12 Gy irradiation at 2 dpf (Scale 500 μm) and quantification of fluorescence intensity of the whole p21:GFP transgenic zebrafish. Each dot represents an animal. Graph represents Mean ± SEM and data were examined by Mann–Whitney test. (b) Transmitted and wide‐field fluorescence photomicrographs taken laterally and ventrally showing p21:GFP fluorescence recapitulated endogenous p21 mRNA expression (Scale bar 100 μm). (c) qPCR of whole zebrafish mRNA demonstrating p21 expression in transgenic p21:GFP and wild‐type strain zebrafish, relative to βactin (2−ΔCt). mRNA was pooled from 50 zebrafish for each independent repeat. The graph represents the mean ± SEM of 3 repeats. Data were examined by 2 way ANOVA with Tukey's multiple comparison test. ****p < 0.0001; ***p < 0.001; **p < 0.01 (d) Representative flow cytometry profiles of dissociated 5 dpf p21:GFP zebrafish and wild‐type siblings treated with either 0 Gy or 12 Gy irradiation and quantitation of the proportion of live p21:GFP‐, p21:GFPDim and p21:GFPBright cells in dissociated 5 dpf p21:GFP zebrafish larvae. Dissociated cells from 50 fish were pooled for each repeat (n = 3) (e) Representative flow cytometry profiles of dissociated 12 dpf p21:GFP zebrafish larvae and wild‐type siblings treated with either 0 Gy or 12 Gy irradiation. Quantification of the proportion of live p21:GFP‐, p21:GFPDim and p21:GFPBright cells in dissociated 12 dpf p21:GFP zebrafish larvae. Dissociated cells from 25 fish were pooled for each experiment (n = 3). Data were examined by 2 way ANOVA with Šidak's multiple comparisons test. (f) The proportion of p21:GFPDim, and p21:GFPBright at 18, 28 and at least 36 months (mo) old in adult p21:GFP zebrafish brains, intestines and livers were quantified. Data were examined by one‐way ANOVA with Sidak's multiple comparison test. Data are presented as mean ± SEM. ***p < 0.001, **p < 0.01; *p < 0.05.
|
