
- Title
-
Nuclear translocation of cGAS orchestrates VEGF-A-mediated angiogenesis
- Authors
- Luo, J., Lu, C., Chen, Y., Wu, X., Zhu, C., Cui, W., Yu, S., Li, N., Pan, Y., Zhao, W., Yang, Q., Yang, X.
- Source
- Full text @ Cell Rep.

The absence of cGAS results in vascular defects in zebrafish (A and B) Representative images (A) and quantification (B) of the number of normal patterning of ISV sprouts in Tg(fli1a:eGFP);cgas−/−, Tg(fli1a:eGFP);sting−/−, and Tg(fli1a:eGFP) larvae at 24, 48, and 72 hpf (n = 16/group). Scale bars, 500 μm (lower magnification) and 200 μm (insets). (C–E) Representative images of vasculatures from brain tissues (C) and quantification of vascular coverage (D) and vessel length (E) in 72 hpf Tg(fli1a:eGFP);cgas−/−, Tg(fli1a:eGFP);sting−/−, and Tg(fli1a:eGFP) larvae (n = 16/group). Scale bar, 200 μm. (F–I) Representative images of vasculatures (F) and quantification of vascular coverage (G, n = 16/group), branch points (H, n = 16/group), and radial outgrowth (I, n = 8/group) in retinal tissues from 1-month-old Tg(fli1a:eGFP);cgas−/− and Tg(fli1a:eGFP) fish. Scale bar, 100 μm. (J and K) Representative images (J) and quantification (K) of the number of sprouts (arrowheads) at vascular front of retinal lobe in 1-month-old Tg(fli1a:eGFP);cgas−/− and Tg(fli1a:eGFP) fish (n = 8/group). Scale bar, 50 μm. (L–O) Representative images (L) and quantification of the total vessel length (M), number of branch points (N), and vascular coverage (O) in brain cortical vasculature of 1-month-old Tg(fli1a:eGFP);cgas−/− and Tg(fli1a:eGFP) fish (n = 16/group). Scale bar, 50 μm. (P and Q) Immunofluorescence (P) and comparison (Q) of VECs (red, arrowheads) in retinal tissues from 1-month-old Tg(fli1a:eGFP);cgas−/− and Tg(fli1a:eGFP) fish (n = 16/group). Scale bar, 20 μm. (R and S) Immunofluorescence (R) and quantification (S) of the number of collagen-IV-negative VECs (green, arrowheads) in collagen-IV-stained (red) retinal tissues from 1-month-old Tg(fli1a:eGFP);cgas−/− and Tg(fli1a:eGFP) fish (n = 16/group). Scale bar, 20 μm. (T) Immunofluorescence of erythroid cells (red) showing the potential hemorrhages (asterisks) in brain tissues from 1-month-old Tg(fli1a:eGFP);cgas−/− and Tg(fli1a:eGFP) fish. Scale bar, 100 μm. Data are represented as means ± SEM. ANOVA in (B), (D), (E), Student’s t test in (G–I), (K), (M–O), (Q), and (S). ∗p < 0.05; ∗∗p < 0.01; ∗∗∗p < 0.001; ns, not significant. See also Figure S1. |
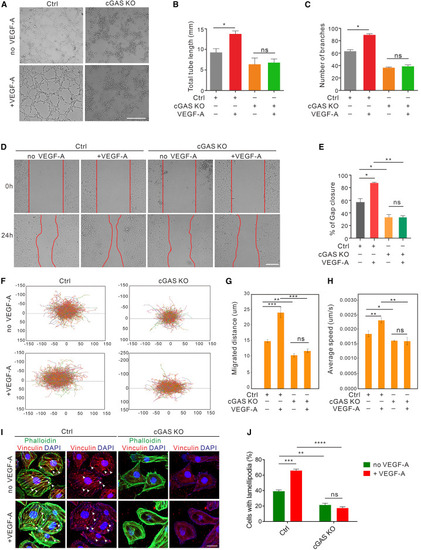
cGAS is required for VEGF-A-induced angiogenesis (A–C) Tube formation (A) and quantification of total tube length (B) and number of branches in cGAS KO and vector control HUVECs with or without VEGF-A treatment (50 ng/mL) for 4 h (n = 12 replicates). Scale bar, 500 μm. (D and E) Scratch migration (D) and quantification (E) in cGAS KO and vector control HUVECs with or without VEGF-A treatment (50 ng/mL) for 12 h (n = 12 replicates). Scale bar, 200 μm. (F–H) Single-cell motility tracks (F) and quantification of the absolute migrated distance (G) and average speed (H) in cGAS KO and vector control HUVECs with or without VEGF-A treatment (50 ng/mL) for 12 h (n = 12 replicates). (I and J) Immunofluorescence (I) and quantification (J) of actin (green) and lamellipodia (red, arrowheads) formation induced by VEGF-A stimulation (50 ng/mL for 30 min) in cGAS-deficient and vector control HUVECs (n = 10 random fields of view [FOV]/group). Scale bar, 25 μm. Data are represented as means ± SEM. ANOVA in all analyses. ∗p < 0.05; ∗∗p < 0.01; ∗∗∗p < 0.001; ns, not significant. See also Figure S2 and Video S1. |
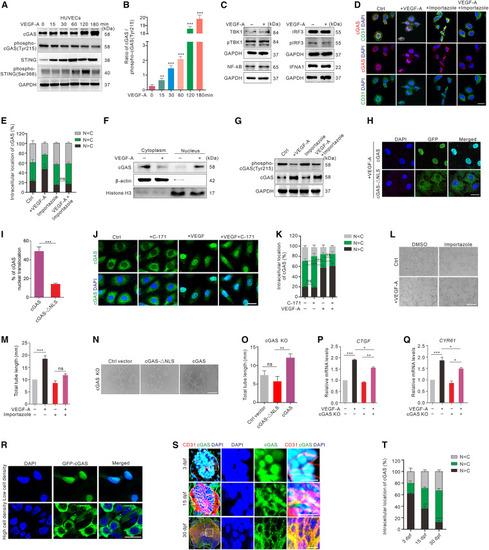
cGAS nuclear translocation is involved in VEGF-A-mediated angiogenesis (A and B) Western blot (A) and quantification (B) of the dephosphorylation of cGAS and STING in HUVECs after VEGF-A stimulation at different time points. (C) The expression of IFNA1, NF-κB, IRF3, pIRF3, TBK1, and pTBK1 in HUVECs with or without VEGF-A stimulation (n = 3 replicates). (D and E) Immunofluorescence (D) and quantification (E) of cGAS (red) intracellular localization in HUVECs treated with or without VEGF-A and/or importazole (n = 12 random FOV/group). Scale bar, 20 μm. (F) The expression of cGAS in nuclear and cytoplasmic fractions in HUVECs with or without VEGF-A stimulation (n = 3 replicates). (G) cGAS dephosphorylation in HUVECs treated with or without VEGF-A and/or importazole. (H and I) Representative images (H) and quantification (I) of the distributions of GFP-labeled cGAS or cGAS with NLS-directed mutagenesis in GFP-FLAG-cGAS-ΔNLS or GFP-FLAG-cGAS vector-transfected cGAS KO HUVECs after VEGF-A stimulation (n = 12 random FOV/group). Scale bar, 20 μm. (J and K) Representative images (J) and quantification (K) of cGAS (green) intracellular localization in VEGF-A and/or C-171-treated HUVECs (n = 12 random FOV/group). Scale bar, 20 μm. (L and M) Tube formation (L) and quantification (M) in HUVECs with or without VEGF-A and/or importazole treatment (n = 3 replicates). Scale bar, 200 μm. (N and O) Tube formation (N) and quantification (O) in control vector-, GFP-FLAG-cGAS-ΔNLS-, or GFP-FLAG-cGAS-transfected cGAS KO HUVECs (n = 3 replicates). Scale bar, 200 μm. (P and Q) Relative mRNA levels of CTGF (P) and CYR61 (Q) in cGAS KO and normal HUVECs before and after 6-h VEGF-A treatment (n = 4 replicates). (R) Representative images of cGAS intracellular distributions in HUVECs stably expressing GFP-cGAS (green) with low- (40% confluence) or high-density (80% confluence). Scale bar, 20 μm. (S and T) Immunofluorescence (S) and quantification (T) of cGAS (green) intracellular localization at different developmental stages in SC of zebrafish (n = 5 replicates). Scale bars, 100 μm (lower magnification) and 20 μm (insets). Data are represented as means ± SEM. Student’s t test in (I), ANOVA in (B), (E), (K), (M), (O–Q), and (T). ∗p < 0.05; ∗∗p < 0.01; ∗∗∗p < 0.001; ns, no significant. C, cytosol; N, nucleus. See also Figures S2 and S3. |
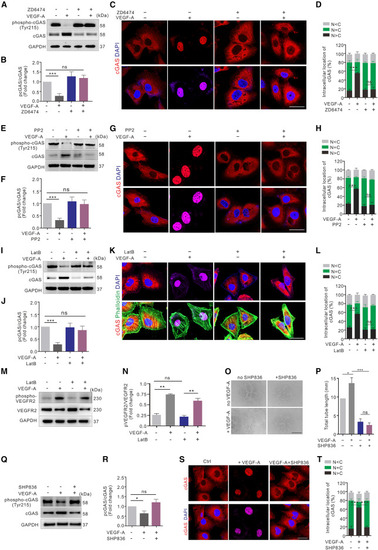
VEGF-A-VEGFR2 cascade induces cGAS nuclear translocation in a cytoskeleton-dependent manner (A and B) Western blot (A) and quantification (B) of cGAS phosphorylation in HUVECs treated with or without ZD6474 and/or VEGF-A (n = 3 replicates). (C and D) Immunofluorescence (C) and quantification (D) of cGAS (red) intracellular localization in HUVECs described in (A) (n = 12 random FOV/group). Scale bar, 20 μm. (E and F) Western blot (E) and quantification (F) of cGAS phosphorylation in HUVECs treated with or without PP2 and/or VEGF-A (n = 4 replicates). (G and H) Immunofluorescence (G) and quantification (H) of cGAS (red) intracellular localization in HUVECs described in (E; n = 12 random FOV/group). Scale bar, 20 μm. (I and J) Western blot (I) and quantification (J) of cGAS phosphorylation in HUVECs treated with or without LatB and/or VEGF-A (n = 4 replicates). (K and L) Immunofluorescence (K) and quantification (L) of cGAS (red) and actin cytoskeleton (green) intracellular localization in HUVECs described in (I) (n = 12 random FOV/group). Scale bar, 20 μm. (M and N) Western blot (M) and quantification (N) of VEGFR2 phosphorylation in HUVECs treated with or without LatB and/or VEGF-A (n = 4 replicates). (O and P) Tube formation (O) and quantification (P) of HUVECs treated with or without SHP836 and/or VEGF-A. Scale bar, 500 μm (n = 12 random FOV/group). (Q and R) Western blot (Q) and quantification (R) of cGAS phosphorylation in HUVECs treated with or without SHP836 and/or VEGF-A (n = 3 replicates). (S and T) Immunofluorescence (S) and quantification (T) of cGAS (red) intracellular localization in HUVECs treated with or without SHP836 and/or VEGF-A (n = 12 random FOV/group). Scale bar, 20 μm. Data are represented as means ± SEM. ANOVA in all analyses. ∗p < 0.05; ∗∗p < 0.01; ∗∗∗p < 0.001; ns, not significant. See also Figure S4. |
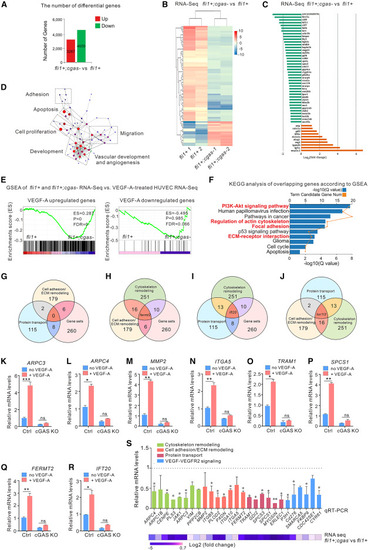
VEGF-A-cGAS cascade-dependent biological network primarily targets cytoskeleton-related genes (A) Total number of DEGs in 3 dpf Tg(fli1a:eGFP);cgas−/− and Tg(fli1a:eGFP) larvae. (B) Heatmap of the top 200 most abundant transcripts in Tg(fli1a:eGFP);cgas−/− and Tg(fli1a:eGFP) larvae. (C) The top 50 up- (green) and downregulated (orange) DEGs in Tg(fli1a:eGFP);cgas−/− and Tg(fli1a:eGFP) larvae. (D) Network visualization of GO terms for vascular-related DEGs between Tg(fli1a:eGFP);cgas−/− and Tg(fli1a:eGFP) larvae. (E) GSEA enrichment plot. (F) KEGG analysis of overlapping genes. (G–J) The overlapped cGAS-targeted genes in different gene sets. (K–R) qRT-PCR confirmation of the overlapped genes in cGAS KO and vector control HUVECs with or without VEGF-A stimulation for 12 h (n = 3 replicates). (S) qRT-PCR assay showed most differentially expressed mRNAs are associated with cytoskeletal remodeling, cell adhesion/ECM remodeling, protein transport, and VEGF-A-VEGFR2 signaling pathways in cGAS KO and vector control groups of HUVECs (upper panel, n = 3 replicates). The potential targeted genes of the identified miRNAs were confirmed by RNA-seq analyses in Tg(fli1a:eGFP) and Tg(fli1a:eGFP);cgas−/− larvae (lower panel). Data are represented as means ± SEM. ANOVA in all analyses. ∗p < 0.05; ∗∗p < 0.01; ∗∗∗p < 0.001; ns, not significant. See also Table S1. Transcriptome analysis in, Table S2. Gene Ontology (GO) analysis showing the differentially expressed genes in, Table S3. List of genes that are both downregulated in, Table S4. KEGG analyzed the signaling pathways of overlapping genes that both downregulated in, Table S5. List of genes indicating that cGAS binding appeared onto cytoskeleton remodeling, cell adhesion ECM remodeling, vesicle-mediated protein transport, and overlapping genes, related to Figure 5. |
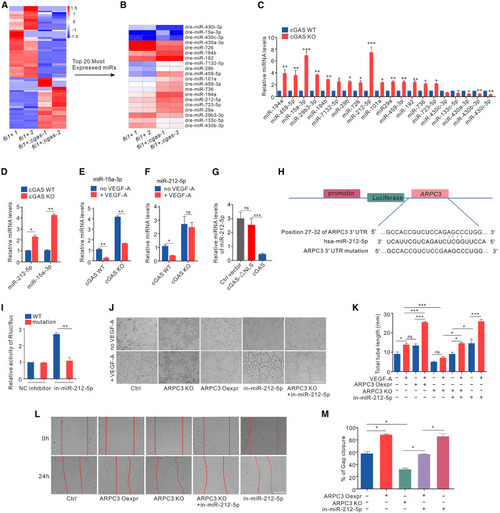
VEGF-A-cGAS cascade induces angiogenesis by regulating miR-212-5p-ARPC3 regulatory loop (A and B) Heatmap (A) and the top 20 (B) differentially expressed miRNAs in Tg(fli1a:eGFP);cgas−/− and Tg(fli1a:eGFP) larvae. (C) qRT-PCR confirmation of top 20 enriched miRNAs (n = 3 replicates). (D) The relative miRNA levels of miR-212-5p and miR-15a-3p in cGAS KO and vector control HUVECs (n = 3 replicates). (E and F) The relative miRNA levels of miR-15a-3p (E) and miR-212-5p (F) in cGAS KO and vector control HUVECs with or without VEGF-A stimulation for 12 h (n = 3 replicates). (G) The relative miRNA levels of miR-212-5p control vector, GFP-FLAG-cGAS-ΔNLS, and GFP-FLAG-cGAS vectors transfected cGAS KO HUVECs (n = 3 replicates). (H) Schematic illustration of the predicted hsa-miR-212-5p binding site for targeting WT and mutant sequences of ARPC3 3′UTR. (I) Luciferase reporter assays in HEK293 cells co-transfected with luciferase reporter vectors containing WT or mutant sequences of ARPC3 3′UTR, and 50 nM miR-212-5p inhibitor or negative control (n = 3 replicates). (J and K) Tube formation (J) and quantification (K) in ARPC3 KO and vector control HUVECs with or without in-miR-212-5p and/or VEGF-A treatment and in ARPC3-overexpressing HUVECs with or without VEGF-A stimulation (n = 3 replicates). Scale bar, 200 μm. (L and M) Scratch migration (L) and quantification (M) in ARPC3 KO or vector control HUVECs with or without in-miR-212-5p treatment, as well as in ARPC3-overexpressing HUVECs at different time points (n = 3 replicates). Scale bar, 500 μm. Data are represented as means ± SEM. ANOVA in all analyses. ∗p < 0.05; ∗∗p < 0.01; ∗∗∗p < 0.001; ns, not significant. See also Figure S5 and Tables S6 and S7. |
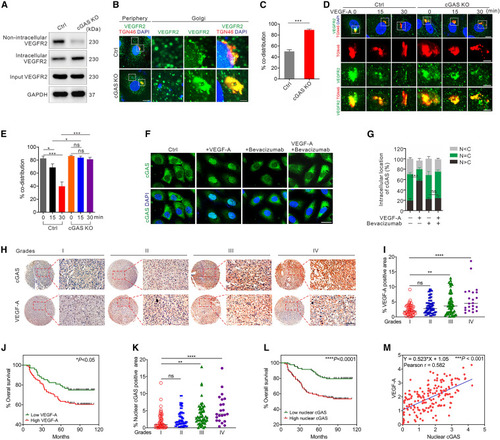
cGAS is critical for proper VEGFR2 trafficking and associated with human pathology (A) Western blot for determining the distribution of VEGFR2 expression in cGAS KO or control HUVECs. (B and C) Immunofluorescence (B) and quantification (C) of the distribution of TGN-associated VEGFR2 in cGAS KO and vector control HUVECs (n = 15/group). Scale bars, 10 μm (lower magnifications) and 2 μm (higher magnifications). (D and E) Representative images (D) and quantification (E) of the dynamic TGN-associated VEGFR2 distribution in cGAS KO and vector control HUVECs (n = 15/group) with VEGF-A stimulation at different time points. Scale bars, 10 μm (lower magnifications) and 5 μm (higher magnifications). (F and G) Representative images (F) and quantification (G) of cGAS intracellular localization in HUVECs treated with VEGF and/or bevacizumab (n = 12 random FOV/group). Scale bar, 20 μm. (H) Immunohistochemistry for determining the expression of cGAS and VEGF-A in human glioma specimens. Scale bar, 50 μm. (I and J) VEGF-A expression is positively correlated with the malignancy (I) and prognosis (J) of human gliomas. (K) The distribution of nuclear cGAS in human gliomas. (L) Patient survival analysis of high- and low-expression of nuclear cGAS in glioma specimens. (M) Correlation analyses of nuclear cGAS and VEGF-A expression in glioma specimens. Data are represented as means ± SEM. Student’s t test in (C), ANOVA in (E), (G), (I), (K); Kaplan-Meier curves in (J) and (L); Pearson’s r test in (M). ∗p < 0.05; ∗∗p < 0.01; ∗∗∗p < 0.001; ∗∗∗∗p < 0.0001; ns, not significant. |