
|
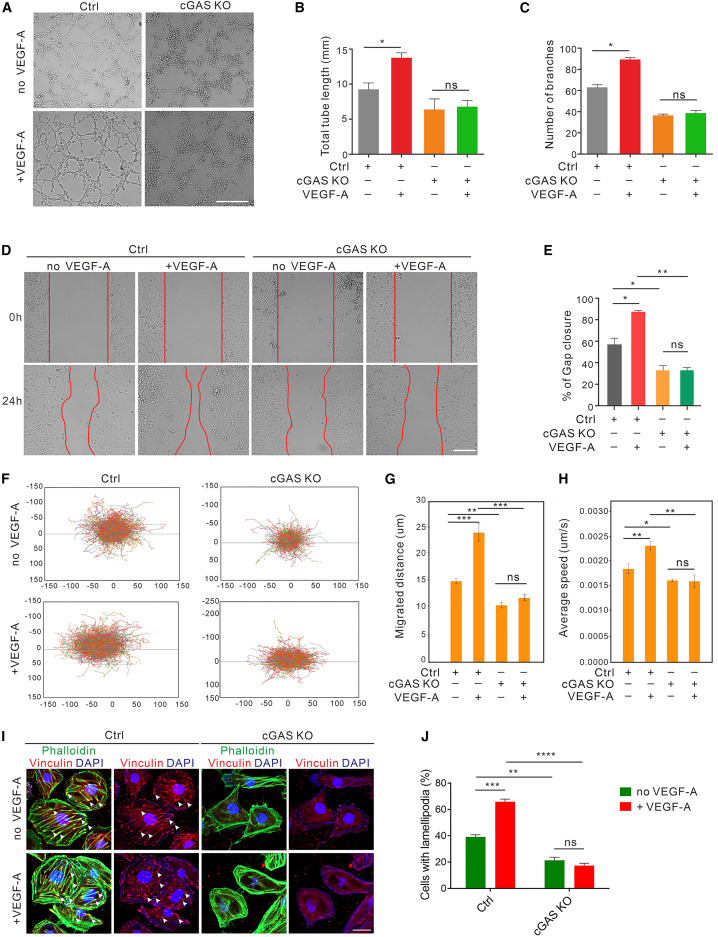
Fig. 2 cGAS is required for VEGF-A-induced angiogenesis (A–C) Tube formation (A) and quantification of total tube length (B) and number of branches in cGAS KO and vector control HUVECs with or without VEGF-A treatment (50 ng/mL) for 4 h (n = 12 replicates). Scale bar, 500 μm. (D and E) Scratch migration (D) and quantification (E) in cGAS KO and vector control HUVECs with or without VEGF-A treatment (50 ng/mL) for 12 h (n = 12 replicates). Scale bar, 200 μm. (F–H) Single-cell motility tracks (F) and quantification of the absolute migrated distance (G) and average speed (H) in cGAS KO and vector control HUVECs with or without VEGF-A treatment (50 ng/mL) for 12 h (n = 12 replicates). (I and J) Immunofluorescence (I) and quantification (J) of actin (green) and lamellipodia (red, arrowheads) formation induced by VEGF-A stimulation (50 ng/mL for 30 min) in cGAS-deficient and vector control HUVECs (n = 10 random fields of view [FOV]/group). Scale bar, 25 μm. Data are represented as means ± SEM. ANOVA in all analyses. ∗p < 0.05; ∗∗p < 0.01; ∗∗∗p < 0.001; ns, not significant. See also Figure S2 and Video S1.