
Fig. 4
- ID
- ZDB-FIG-240111-18
- Publication
- Luo et al., 2023 - Nuclear translocation of cGAS orchestrates VEGF-A-mediated angiogenesis
- Other Figures
- All Figure Page
- Back to All Figure Page
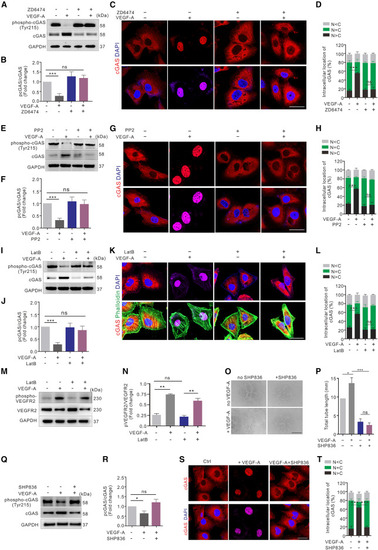
VEGF-A-VEGFR2 cascade induces cGAS nuclear translocation in a cytoskeleton-dependent manner (A and B) Western blot (A) and quantification (B) of cGAS phosphorylation in HUVECs treated with or without ZD6474 and/or VEGF-A (n = 3 replicates). (C and D) Immunofluorescence (C) and quantification (D) of cGAS (red) intracellular localization in HUVECs described in (A) (n = 12 random FOV/group). Scale bar, 20 μm. (E and F) Western blot (E) and quantification (F) of cGAS phosphorylation in HUVECs treated with or without PP2 and/or VEGF-A (n = 4 replicates). (G and H) Immunofluorescence (G) and quantification (H) of cGAS (red) intracellular localization in HUVECs described in (E; n = 12 random FOV/group). Scale bar, 20 μm. (I and J) Western blot (I) and quantification (J) of cGAS phosphorylation in HUVECs treated with or without LatB and/or VEGF-A (n = 4 replicates). (K and L) Immunofluorescence (K) and quantification (L) of cGAS (red) and actin cytoskeleton (green) intracellular localization in HUVECs described in (I) (n = 12 random FOV/group). Scale bar, 20 μm. (M and N) Western blot (M) and quantification (N) of VEGFR2 phosphorylation in HUVECs treated with or without LatB and/or VEGF-A (n = 4 replicates). (O and P) Tube formation (O) and quantification (P) of HUVECs treated with or without SHP836 and/or VEGF-A. Scale bar, 500 μm (n = 12 random FOV/group). (Q and R) Western blot (Q) and quantification (R) of cGAS phosphorylation in HUVECs treated with or without SHP836 and/or VEGF-A (n = 3 replicates). (S and T) Immunofluorescence (S) and quantification (T) of cGAS (red) intracellular localization in HUVECs treated with or without SHP836 and/or VEGF-A (n = 12 random FOV/group). Scale bar, 20 μm. Data are represented as means ± SEM. ANOVA in all analyses. ∗p < 0.05; ∗∗p < 0.01; ∗∗∗p < 0.001; ns, not significant. See also Figure S4. |