
- Title
-
Nodal coordinates the anterior-posterior patterning of germ layers and induces head formation in zebrafish explants
- Authors
- Cheng, T., Xing, Y.Y., Liu, C., Li, Y.F., Huang, Y., Liu, X., Zhang, Y.J., Zhao, G.Q., Dong, Y., Fu, X.X., Tian, Y.M., Shu, L.P., Megason, S.G., Xu, P.F.
- Source
- Full text @ Cell Rep.

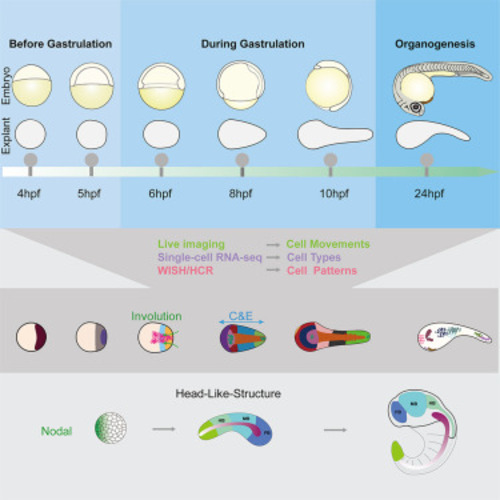
Nodal-induced cell movements in zebrafish animal pole explants recapitulated gastrulation (A) One blastomere at the animal pole was injected with 10 pg ndr2 mRNA at the 64- to 128-cell stage; uninjected embryos served as controls. The animal halves of the injected and uninjected embryos were cut off at 3 hpf and cultured in serum replacement medium. (B and C) Time series of confocal z stack maximum projections of a representative WT explant (B) and Nodal explant (C). All nuclei were marked by H2B:EGFP expression (green), nucleus marked by magenta florescent signal indicated descendants of the injected cells (H2B-RFP mRNA was injected in WT explant, H2B-RFP plus ndr2 mRNA was injected in Nodal explant) at 128-cell stage. (D) Time series of 3D reconstruction of a representative Nodal explant. All cell membranes were labeled by membrane-targeted mCherry (magenta), cells marked by membranal green florescent signal were descendants of the Nodal-injected (membrane mCitrine plus ndr2 mRNA) cells at 128-cell stage (top). The leading-edge cells of the involuting cluster extended a large number of protrusions as white arrows indicated, and images on the upper left corner showed enlarged regions as the white dashed boxes indicated (bottom). (E) Schematic representation of the main cell movements in Nodal-injected explants and wild-type embryos during gastrulation. Each live imaging experiment was performed for at least three independent replicates (technical replicates). Scale bars: 200 μm (A), 50 μm (B–D). hpf, hours postfertilization. See also Figure S1 and Videos S1 and S3. |

Cell types and patterns in Nodal explant before and at onset of gastrulation (A) Single-cell transcriptomes were collected from Nodal explants at 4, 5, and 6 hpf. Representative explants at each time point are aligned chronologically in the second row; the corresponding embryos at each time point are shown in the top row. Cell-type annotations and corresponding colors are shown at the right. (B, F, and J) UMAP plot of single-cell transcriptomes (leftmost); cells are colored according to their cell-type annotations. UMAP colored according to expression of indicated genes (selected marker genes of each cluster) (left) and WISH for the same genes in Nodal explants (middle) and embryos (right). (C–E, G–I, and O–Q) Simplified schematics of the main cell types and their patterns in Nodal explants (C, D, G, H, and O–P) and embryos at the same stages (E, I, and Q). (C) Schematic diagram of the main cell types and patterns in the Nodal explants at 4 hpf; side view of the Nodal explant showed a dorsal-ventral pattern at this stage, which was similar to the wild-type embryo at the same stage (E). (D) The epiblast and dorsal margin were homogeneous and showed no pattern at this stage, respectively. (G–I) Schematic diagram of the main cell types and patterns in the Nodal explants (G and H) and wild-type embryos (I) at 5 hpf. (K) Normalized expression domain of ectoderm (C9, sox2 and vox), mesendoderm (C10, frzb and sox32), mesoderm-dorsal (C11, noto), and mesoderm-lateral (C12, cdx4) marker genes along the A/V-P/D (anterior/ventral-posterior/dorsal) axis of Nodal explants at 6 hpf. (L and M) Hybridization chain reaction (HCR) co-staining of key markers of Nodal explant at 6 hpf. Quantifications of the expression domains of the genes along A-P (V-D, ventral-dorsal) axis in Nodal explant were shown in the bottom. (N) Double ISH of tbxta (red, C11)/cdx4 (black, C12) (left) and tbxta (red, C11)/id3 (black, C10) (right) in Nodal explant at 6 hpf. (O–Q) Schematic diagram of the main cell types and patterns in the Nodal explants and wild-type embryos at 6 hpf. The statistics of observed/total sampled Nodal explants were shown in bottom left of the panels (biological replicates). Each ISH or HCR experiment was performed for at least 2–3 independent replicates (technical replicates). Scale bars: 200 μm (B, F, J, and N), 50 μm (L and M). See also Figure S2, Table S1, and Data S1. |
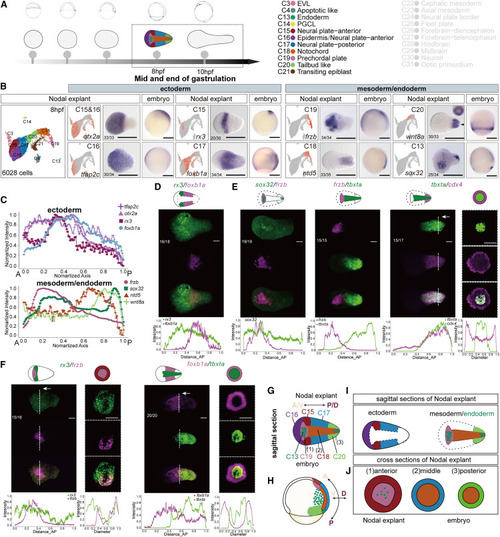
Cell types and patterns in Nodal explants at the middle gastrulation (A) Single-cell transcriptomes were collected from Nodal explants at 8 hpf. Cell-type annotations and their corresponding colors are shown at the right (clusters colored in gray indicate the cell types of Nodal explant at 10 hpf). (B) UMAP plot of single-cell transcriptomes (leftmost); cells are colored according to their cell-type annotations. UMAP colored according to expression of the indicated genes (selected marker genes of each cluster) (left) and WISH for the same genes in Nodal explants (middle) and embryos (right). (C) Normalized expression domain of ectoderm markers (tfap2c, otx2a, rx3, and foxb1a) (top) and mesoderm/endoderm markers (frzb, sox32, ntd5, and wnt8a) along the A-P axis of Nodal explants at 8 hpf. (D–F) HCR co-staining of key markers of ectoderm (D), mesoderm/endoderm (E) and ectoderm and mesoderm (F) in Nodal explant at 8 hpf. Sections of HCR co-staining samples (locations of the sections as white vertical dotted line and white arrows indicated) were imaged (E and F) to visualize the expression patterns of key markers on the cross sections of Nodal explant along the A-P axis. Normalized expression domains of the genes were shown at the bottom of each panel. (G–J) Simplified schematics of the main cell types and their patterns in the Nodal explants (G, I, and J) and embryos (H) at the same stages. The statistics of observed/total sampled Nodal explants were shown in bottom left of the panels (biological replicates). Each ISH or HCR experiment was performed for at least 2–3 independent replicates (technical replicates). Scale bars: 200 μm (B), 50 μm (D–F). See also Figure S3, Table S1, and Data S1. |

Cell types and patterns in Nodal explants at the end of gastrulation (A) Single-cell transcriptomes were collected from Nodal explants at 10 hpf. (B) UMAP plot of single-cell transcriptomes; cells are colored according to their cell-type annotations. Cell-type annotations and their corresponding colors are shown at the right (clusters colored in gray indicate the cell types of Nodal explant at 8 hpf). (C) UMAP colored according to expression of the indicated genes (selected marker genes of each cluster) (left) and WISH for the same genes in Nodal explants (middle) and embryos (right). Normalized expression domain of ectoderm (dlx3b, rx3, dbx1a, pax2a, and gbx1) and mesoderm/endoderm (zgc:174153, sox32, insb, aplnr2 and cdx4) marker genes along the A-P axis of Nodal explants at 10 hpf (bottom). (D–F) HCR co-staining of key markers of ectoderm (D), mesoderm/endoderm (E), and ectoderm and mesoderm (F) in Nodal explant at 10 hpf. Sections of HCR co-staining samples (locations of the sections are as white vertical dotted line and white arrows indicated) were imaged to visualize the expression patterns of the genes along the D-V axis (perpendicular to the A-P axis) (E and F). Normalized expression domains of the genes were shown at the bottom of each panel. (G–J) Schematic cartoons show the main cell types and their patterns in the Nodal explants. The statistics of observed/total sampled Nodal explants were shown in bottom left of the panels (biological replicates). Each ISH or HCR experiment was performed for at least 2–3 independent replicates (technical replicates). Scale bars: 200 μm (C), 50 μm (D–F). See also Figure S3, Table S1, and Data S1. |
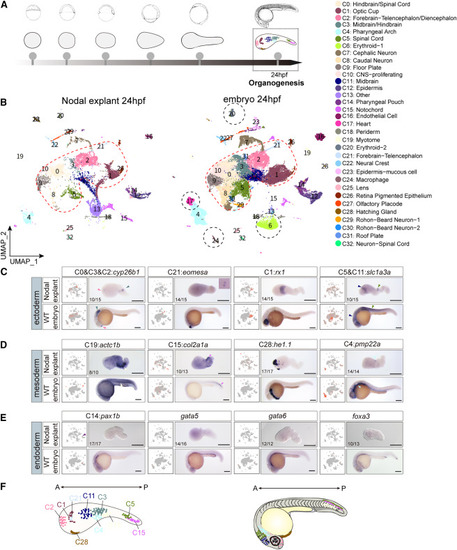
Comparison of cell types and patterns in Nodal explants and embryos at organogenesis stage (A) Schematic representation of collected single-cell transcriptomes of Nodal explants; 24 hpf stage is highlighted. (B) UMAP plot of joint CCA (canonical correlation analysis) clusters of integrated single-cell RNA-seq data (Nodal explants data and published embryonic data at 24 hpf). Cells are colored by clusters. Cell-type annotations and corresponding colors are shown at the right. Dotted black circles in the UMAP indicate clusters were nearly absent in Nodal explants. Red dotted lines indicate CNS clusters. (C–E) UMAP (left, colored by expression level) and ISH (right) revealing expression of selected marker genes of neural ectoderm (C), mesoderm (D), and endoderm (E) in Nodal explants (top) and embryos (bottom) at 24 hpf. (F) Cartoon illustrating the major cell types and their patterns identified in Nodal explants and their corresponding positions in zebrafish embryos at 24 hpf. The statistics of observed/total sampled Nodal explants were shown in bottom left of the panels (biological replicates). Each ISH experiment was performed for at least 3 independent replicates (technical replicates). Scale bars: 200 μm (C–E). See also Figure S4, Table S1, and Data S1. |

Identification of Nodal downstream genes with head organizer functions (A) Schematic representation of the experimental workflow of bulk RNA-seq in the explants. RNA-seq was performed for biological triplicates. (B) Venn diagrams show the 105 identified overlapping Nodal targets at three time points. (C and D) Selection of organizer cells from single-cell transcriptome of the 6 hpf Nodal explants. UMAP plot of Nodal explants at 6 hpf; cells are colored according to cell clusters (C) and expression of gsc (D), the first identified dorsal organizer gene47 highly expressed in clusters 3 and 5 (C, black frame). (E) Dendrogram layout of URD differentiation tree of Nodal explants from 4 to 10 hpf. Cells are colored according to developmental stages. (F) Organizer cells (red dots) were shown on the URD tree of Nodal explants. (G) Dot plot visualization of 25 Nodal targets that were highly expressed in organizer cells. Dot size indicates the percentage of cells within a cell group; the color indicates the average expression level. (H) Ventral overexpression of candidate genes. Fluorescein indicated the clones of the injected blastomere at the 32-cell stage. (I) Upper: merged images of live embryos injected with ndr2 mRNA or dye only (control). Middle: ISH of six3b (forebrain), egr2b (hindbrain), and shha (notochord) showed indicated structures of the primary and induced secondary axis at 12 hpf. Bottom: ISH of pax2a (midbrain-hindbrain boundary [mhb]), otic placode (op), and cdx4 (posterior mesoderm and posterior neural ectoderm) showed indicated structures of the primary and induced secondary axes at 12 hpf. Red dashed lines indicate induced secondary axes. (J) WISH of selected genes from 25 Nodal targets (in G) in Nodal explants and embryos at 6 and 10 hpf. (K) ISH of indicated genes showed the axis induction capabilities of Nodal targets (as shown in I). (L) Illustration of axis induction capabilities of 14 Nodal targets. The statistics of observed/total sampled Nodal explants (J) and embryos with secondary axis (I and K) were shown in bottom left (J) or bottom right (I and K) of the panels (biological replicates). Each secondary axis induction experiment was performed for at least 5 independent replicates, and each ISH experiment was performed for at least 3 independent replicates (technical replicates). Scale bars: 200 μm (I–K). CHX, cycloheximide; CM, cephalic mesoderm; Endo, endoderm; Epi, epidermis; EVL, enveloping layer; FB/OP, forebrain/optical; FP, floor plate; HB, hindbrain; MB, midbrain; NT, notochord; PGCL, primordial germ cell-like; PP, prechordal plate; TBL, tailbud-like. See also Figures S5–S7, Table S1, and Data S1. |

An overview of strategies for constructing gastruloids An “anterior-gastruloid” can be generated by applying a regional Nodal gradient in a group of naive cells (the animal pole explants of zebrafish in this work, upper). This gastruloid contains mainly the axial mesoderm (red region) and neural ectoderm (blue region) and further developed into an “HLS” structure with FB, MB, and HB, which was mapped to a representative vertebrate embryo. While under the activation of a BMP4 signaling center7 or exogenous WNT signaling,6,8,63 aggregates of pluripotent cells can develop into a “posterior-gastruloid,” which mainly comprises the tissues of trunk and tail region (“TLS,” bottom). Black arrow within “anterior-gastruloid” indicates involution movements (Inv) of mesendoderm, and curved two-headed arrows indicate the convergence and extension (C and E) movements in both kinds of gastruloid. |
|