
|
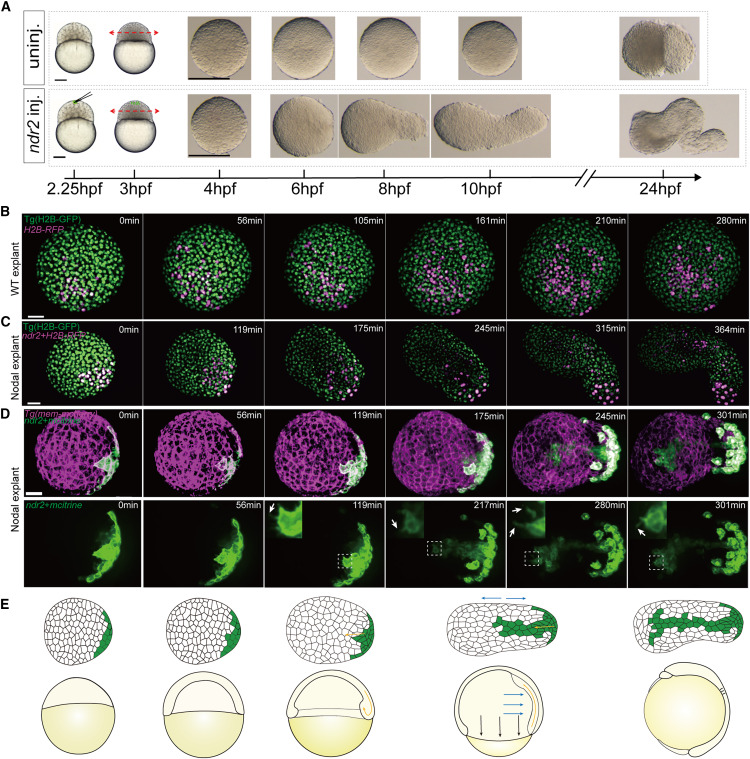
Fig. 1 Nodal-induced cell movements in zebrafish animal pole explants recapitulated gastrulation (A) One blastomere at the animal pole was injected with 10 pg ndr2 mRNA at the 64- to 128-cell stage; uninjected embryos served as controls. The animal halves of the injected and uninjected embryos were cut off at 3 hpf and cultured in serum replacement medium. (B and C) Time series of confocal z stack maximum projections of a representative WT explant (B) and Nodal explant (C). All nuclei were marked by H2B:EGFP expression (green), nucleus marked by magenta florescent signal indicated descendants of the injected cells (H2B-RFP mRNA was injected in WT explant, H2B-RFP plus ndr2 mRNA was injected in Nodal explant) at 128-cell stage. (D) Time series of 3D reconstruction of a representative Nodal explant. All cell membranes were labeled by membrane-targeted mCherry (magenta), cells marked by membranal green florescent signal were descendants of the Nodal-injected (membrane mCitrine plus ndr2 mRNA) cells at 128-cell stage (top). The leading-edge cells of the involuting cluster extended a large number of protrusions as white arrows indicated, and images on the upper left corner showed enlarged regions as the white dashed boxes indicated (bottom). (E) Schematic representation of the main cell movements in Nodal-injected explants and wild-type embryos during gastrulation. Each live imaging experiment was performed for at least three independent replicates (technical replicates). Scale bars: 200 μm (A), 50 μm (B–D). hpf, hours postfertilization. See also Figure S1 and Videos S1 and S3.