
|
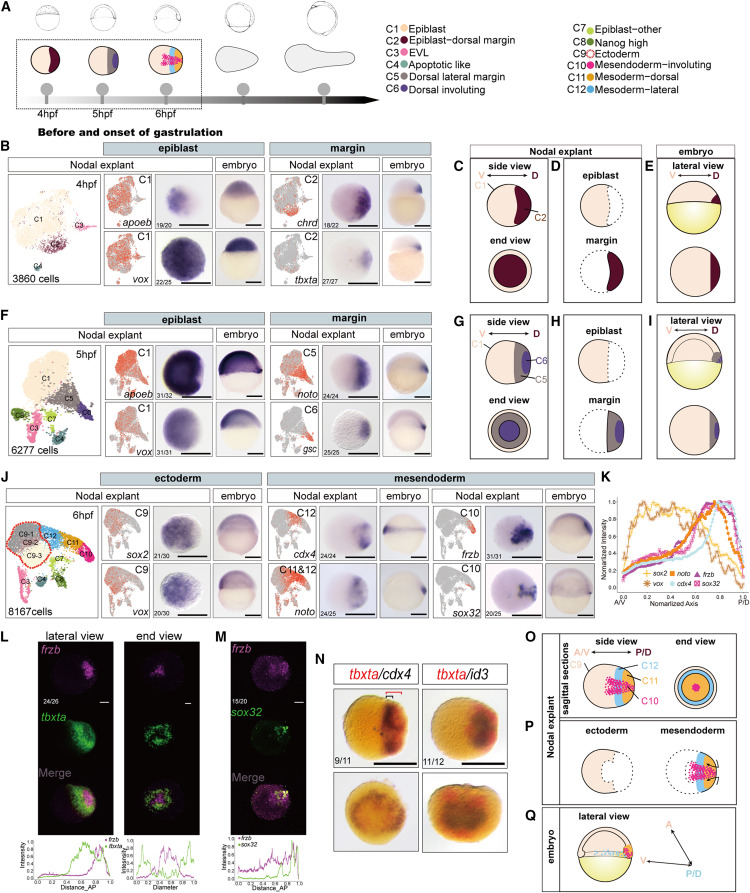
Fig. 2 Cell types and patterns in Nodal explant before and at onset of gastrulation (A) Single-cell transcriptomes were collected from Nodal explants at 4, 5, and 6 hpf. Representative explants at each time point are aligned chronologically in the second row; the corresponding embryos at each time point are shown in the top row. Cell-type annotations and corresponding colors are shown at the right. (B, F, and J) UMAP plot of single-cell transcriptomes (leftmost); cells are colored according to their cell-type annotations. UMAP colored according to expression of indicated genes (selected marker genes of each cluster) (left) and WISH for the same genes in Nodal explants (middle) and embryos (right). (C–E, G–I, and O–Q) Simplified schematics of the main cell types and their patterns in Nodal explants (C, D, G, H, and O–P) and embryos at the same stages (E, I, and Q). (C) Schematic diagram of the main cell types and patterns in the Nodal explants at 4 hpf; side view of the Nodal explant showed a dorsal-ventral pattern at this stage, which was similar to the wild-type embryo at the same stage (E). (D) The epiblast and dorsal margin were homogeneous and showed no pattern at this stage, respectively. (G–I) Schematic diagram of the main cell types and patterns in the Nodal explants (G and H) and wild-type embryos (I) at 5 hpf. (K) Normalized expression domain of ectoderm (C9, sox2 and vox), mesendoderm (C10, frzb and sox32), mesoderm-dorsal (C11, noto), and mesoderm-lateral (C12, cdx4) marker genes along the A/V-P/D (anterior/ventral-posterior/dorsal) axis of Nodal explants at 6 hpf. (L and M) Hybridization chain reaction (HCR) co-staining of key markers of Nodal explant at 6 hpf. Quantifications of the expression domains of the genes along A-P (V-D, ventral-dorsal) axis in Nodal explant were shown in the bottom. (N) Double ISH of tbxta (red, C11)/cdx4 (black, C12) (left) and tbxta (red, C11)/id3 (black, C10) (right) in Nodal explant at 6 hpf. (O–Q) Schematic diagram of the main cell types and patterns in the Nodal explants and wild-type embryos at 6 hpf. The statistics of observed/total sampled Nodal explants were shown in bottom left of the panels (biological replicates). Each ISH or HCR experiment was performed for at least 2–3 independent replicates (technical replicates). Scale bars: 200 μm (B, F, J, and N), 50 μm (L and M). See also Figure S2, Table S1, and Data S1.