
|
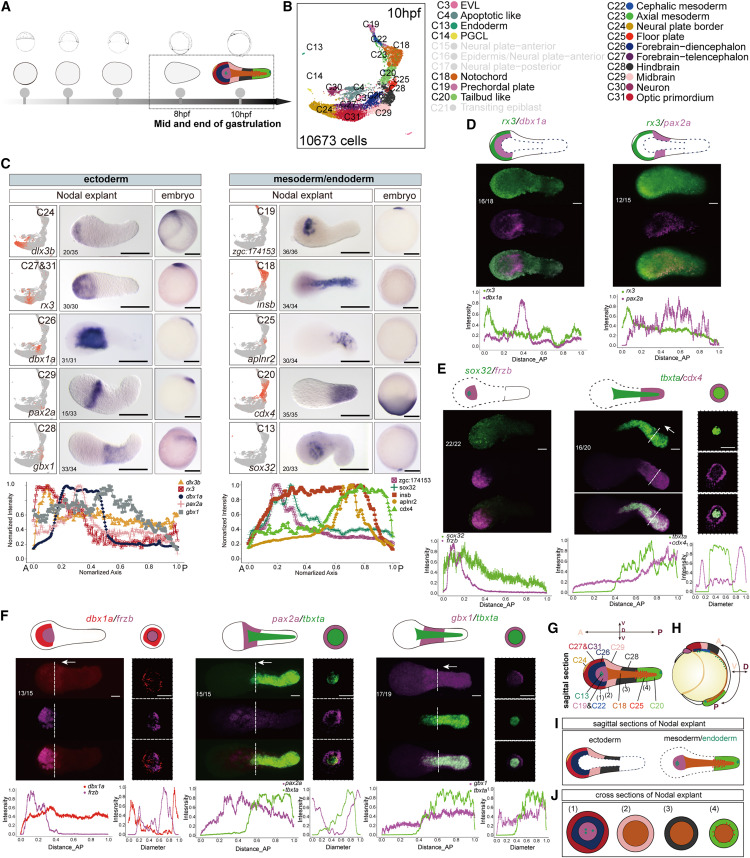
Fig. 4 Cell types and patterns in Nodal explants at the end of gastrulation (A) Single-cell transcriptomes were collected from Nodal explants at 10 hpf. (B) UMAP plot of single-cell transcriptomes; cells are colored according to their cell-type annotations. Cell-type annotations and their corresponding colors are shown at the right (clusters colored in gray indicate the cell types of Nodal explant at 8 hpf). (C) UMAP colored according to expression of the indicated genes (selected marker genes of each cluster) (left) and WISH for the same genes in Nodal explants (middle) and embryos (right). Normalized expression domain of ectoderm (dlx3b, rx3, dbx1a, pax2a, and gbx1) and mesoderm/endoderm (zgc:174153, sox32, insb, aplnr2 and cdx4) marker genes along the A-P axis of Nodal explants at 10 hpf (bottom). (D–F) HCR co-staining of key markers of ectoderm (D), mesoderm/endoderm (E), and ectoderm and mesoderm (F) in Nodal explant at 10 hpf. Sections of HCR co-staining samples (locations of the sections are as white vertical dotted line and white arrows indicated) were imaged to visualize the expression patterns of the genes along the D-V axis (perpendicular to the A-P axis) (E and F). Normalized expression domains of the genes were shown at the bottom of each panel. (G–J) Schematic cartoons show the main cell types and their patterns in the Nodal explants. The statistics of observed/total sampled Nodal explants were shown in bottom left of the panels (biological replicates). Each ISH or HCR experiment was performed for at least 2–3 independent replicates (technical replicates). Scale bars: 200 μm (C), 50 μm (D–F). See also Figure S3, Table S1, and Data S1.