
- Title
-
Coupling Environmental Whole Mixture Toxicity Screening with Unbiased RNA-Seq Reveals Site-Specific Biological Responses in Zebrafish
- Authors
- Rude, C.I., Tidwell, L.G., Tilton, S.C., Waters, K.M., Anderson, K.A., Tanguay, R.L.
- Source
- Full text @ Toxics
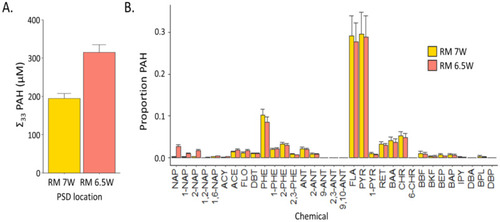
The results of the chemical analysis from the extracts of HDPE-PSDs deployed at RM 7W and RM 6.5 W during September 2009 and July 2010, respectively. The concentrations are reported at the expected levels in 1% extract exposures. (A) The sum uM of each PSD extract for the 33 PAHs included in the quantitative PAH method. (B) The proportion of each individual PAH measured in the 33 PAH method. |
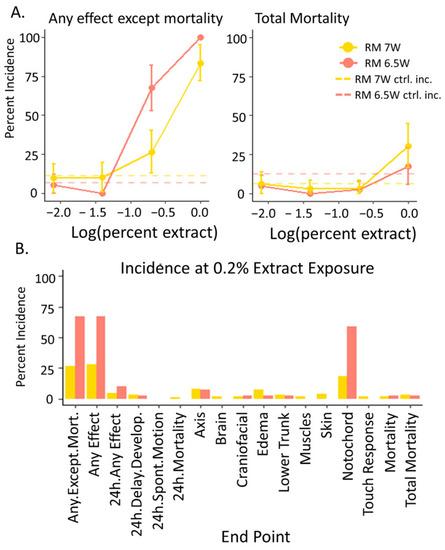
Concentration response data for the embryos exposed to the PSD extracts from RM 7W (September 2009) and RM 6.5W (July 2010) in the PHSS determined by the response of 40 developing zebrafish to each dose. (A) The percent incidence in the endpoints “any effect except mortality” and “mortality” in zebrafish by 120 hpf. Error bars indicate the 95% confidence intervals calculated utilizing the binomial distribution with n = 40. The hashed lines indicated the response levels in the vehicle controls associated with each mixture. (B) The observed percent incidence of every measured endpoint determined at the 0.2% extract exposure. |
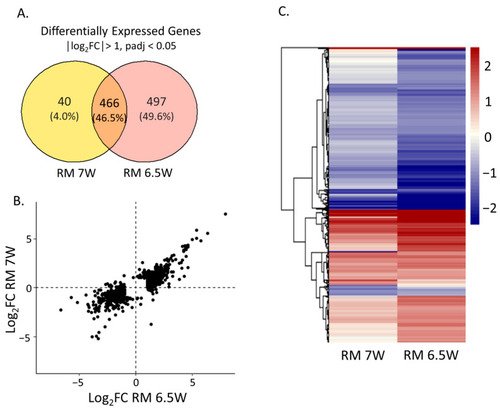
Differential expression in the embryos at 48 hpf after static exposure to the 0.75% extracts in embryo media from 6–48 hpf compared to the DMSO exposed control embryos. (A) The numbers of unique and shared differentially expressed genes (DEGs) meeting the threshold of │log2FC│ > 1, padj > 0.05 for each sample. (B) Log2FC of gene expression comparing the exposure conditions for any gene differentially expressed under at least one of the conditions. (C) Heatmap displaying the Log2FC of each sample, with genes clustered hierarchically by Euclidian distance. |
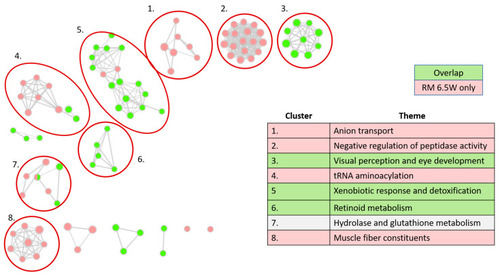
Gene Ontology (GO) network analysis. Each node is a significant GO term from one of three GO: Biological Processes (GO:BP), Cellular Components (GO:CC), or Molecular Functions (GO:MF). Ontologies were truncated to GO terms containing between 15 and 450 genes before computing significant adjuster enrichments on g.profiler2. Edges indicate the proportion of shared genes between terms, with an overlap coefficient (Coverlap = nintersect/ngenes in smaller term) of at least 0.4. Node color indicates gene sets. Gene sets included DEGs meeting │log2FC│ > 0.5 and padj > 0.05, from one of three categories: DEGs specific to RM7 W, DEGs shared between the two treatments, and DEGs specific to RM 6.5W. There were no significant GO terms enriched in the gene set specific to RM 7W. The table indicates the manually determined themes for each cluster. |
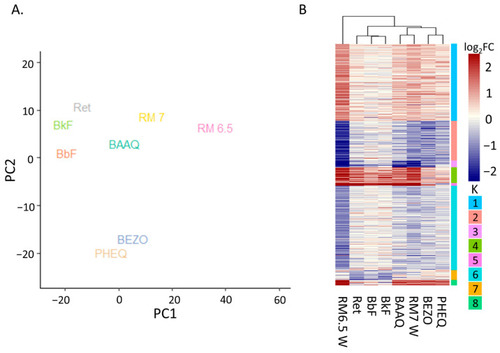
Comparison of the DEGs from the PHSS extract treatments and treatment with PAHs or OPAHs. (A) PCA analysis using DEGs of each treatment. PC1 accounts for 53% of variance, PC2 accounts for 20 % of variance. (B) A heatmap displaying log2FCs for each gene significant in at least one of the treatments (│log2FC│ > 1 and padj <= 0.05). Rows are grouped by k-means (k = 8) and columns are clustered by Euclidian distance. |
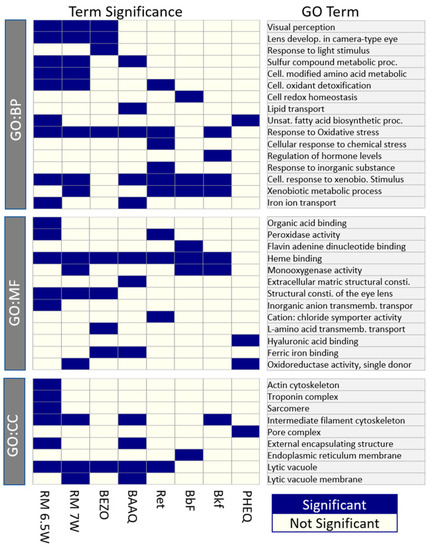
The significant GO terms from the reduced redundancy GO set. Enrichment was tested for the DEGs meeting the criteria of |log2FC| > 0.5, padj < 0.5 for each exposure. Column order was chosen to simplify the comparison between the PHSS extracts and individual chemical exposures. Rows are split by the GO database then clustered by the Jaccard distance of shared genes. |