
|
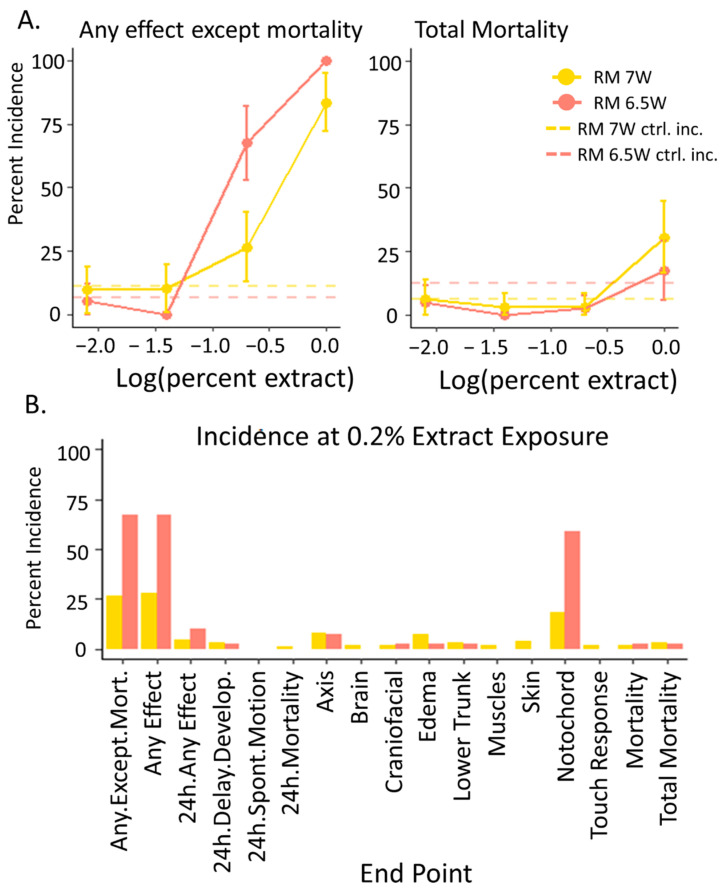
Figure 2
Concentration response data for the embryos exposed to the PSD extracts from RM 7W (September 2009) and RM 6.5W (July 2010) in the PHSS determined by the response of 40 developing zebrafish to each dose. (A) The percent incidence in the endpoints “any effect except mortality” and “mortality” in zebrafish by 120 hpf. Error bars indicate the 95% confidence intervals calculated utilizing the binomial distribution with n = 40. The hashed lines indicated the response levels in the vehicle controls associated with each mixture. (B) The observed percent incidence of every measured endpoint determined at the 0.2% extract exposure.