
FIGURE
Figure 5
- ID
- ZDB-FIG-230401-50
- Publication
- Rude et al., 2023 - Coupling Environmental Whole Mixture Toxicity Screening with Unbiased RNA-Seq Reveals Site-Specific Biological Responses in Zebrafish
- Other Figures
- All Figure Page
- Back to All Figure Page
Figure 5
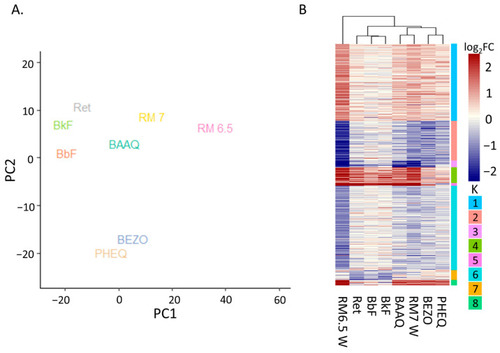
Comparison of the DEGs from the PHSS extract treatments and treatment with PAHs or OPAHs. (A) PCA analysis using DEGs of each treatment. PC1 accounts for 53% of variance, PC2 accounts for 20 % of variance. (B) A heatmap displaying log2FCs for each gene significant in at least one of the treatments (│log2FC│ > 1 and padj <= 0.05). Rows are grouped by k-means (k = 8) and columns are clustered by Euclidian distance. |
Expression Data
| Genes: | |
|---|---|
| Fish: | |
| Conditions: | |
| Anatomical Term: | |
| Stage Range: | Shield to Long-pec |
Expression Detail
Antibody Labeling
Phenotype Data
| Fish: | |
|---|---|
| Conditions: | |
| Observed In: | |
| Stage Range: | Shield to Long-pec |
Phenotype Detail
Acknowledgments
This image is the copyrighted work of the attributed author or publisher, and
ZFIN has permission only to display this image to its users.
Additional permissions should be obtained from the applicable author or publisher of the image.
Full text @ Toxics