
- Title
-
Socs3b regulates the development and function of innate immune cells in zebrafish
- Authors
- Sobah, M.L., Scott, A.C., Laird, M., Koole, C., Liongue, C., Ward, A.C.
- Source
- Full text @ Front Immunol
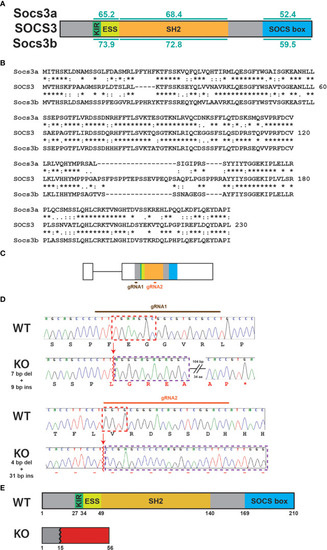
Generation of socs3b KO allele. Schematic of the SOCS3 protein displaying conserved functional domains (KIR: kinase inhibitory region, ESS: extended SH2 sub-domain, SH2: Src homology 2 domain, SOCS box) along with the relative conservation (% identity) of zebrafish Socs3a and Socs3b to the indicated domains (A), as well as alignment of SOCS3 with Socs3a and Socs3b sequences |
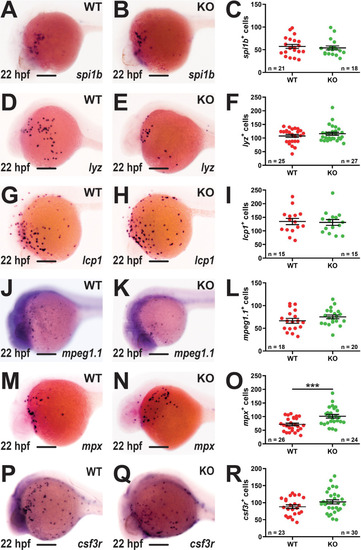
Effect of socs3b ablation on primitive hematopoiesis. Representative images of wildtype (WT, socs3bwt/wt) and knockout (KO, socs3bmdu24/mdu24) embryos subjected to WISH using spi1b(A, B), lyz EXPRESSION / LABELING:
PHENOTYPE:
|
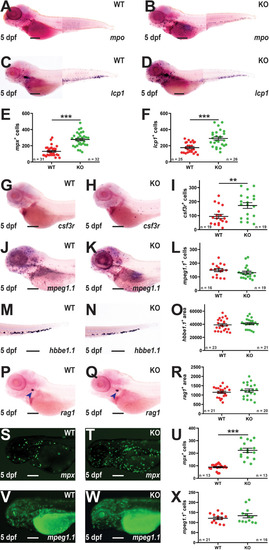
Effect of socs3b ablation on early definitive hematopoiesis. Representative images of wildtype (WT, socs3bwt/wt) and knockout (KO, socs3bmdu24/mdu24) embryos subjected to WISH using mpx(A, B), lcp1(C, D), csf3r(G, H), mpeg1.1(J, K), hbbe1.1(M, N) and rag1(P, Q) at 5 dpf, showing the major areas of staining in each case, with scale bars representing 200 μm. Fluorescent images of WT and KO embryos on either the Tg(mpx::GFP) (S, T) or Tg(mpeg1.1::GFP) (V, W) transgenic backgrounds, with scale bars representing 200 μm. Quantitation of mpx+(E), lcp1+(F), csf3r+(I), mpeg1.1+(L) and GFP+ cells in Tg(mpx::GFP) (U) and Tg(mpeg1.1::GFP) (X) embryos, and area of staining for hbbe1.1(O) and rag1(R) showing values for individual embryos along with mean and SEM, with statistical significance indicated. Student t-tests were used to measure the significance between WT and KO with Welch’s correction performed if required (*** p < 0.001, ** p < 0.01). |
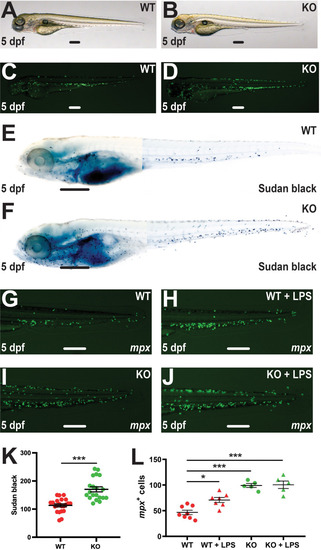
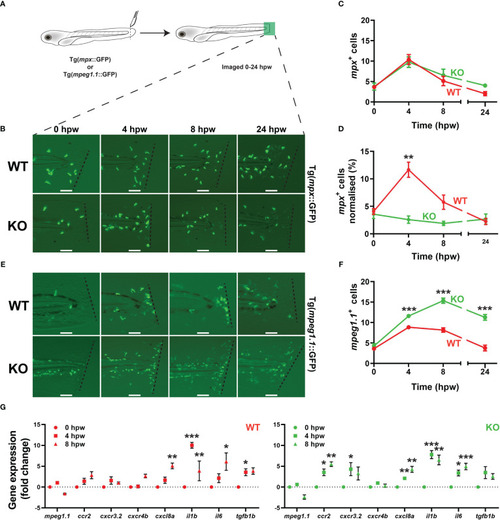
Effect of socs3b ablation on neutrophil maturation and functionality. Wildtype (WT, socs3bwt/wt) and knockout (KO, socs3bmdu24/mdu24) embryos on the Tg(mpx::GFP) transgenic background at 5 dpf imaged by light (A, B) and fluorescence (C, D) microscopy or subjected to Sudan black staining (E, F), showing representative images in each case. Embryos were also subjected to microinjection with LPS at 5 dpf and imaged by fluorescence microscopy 8 hours later (G–J), showing representative images. Scale bars represent 100 μm. Quantitation of Sudan black+(K) or mpx+ cells (L) with mean and SEM shown, with significance tested using one-way ANOVA (***p < 0.001, *p < 0.05, n = 8-12). |
Effect of |
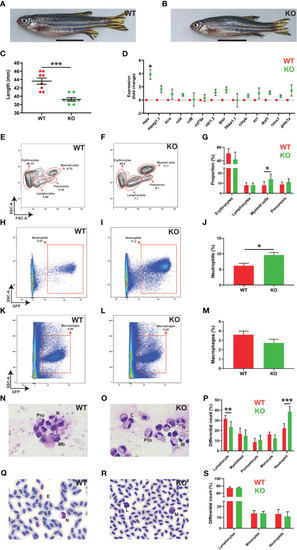
Effects of socs3b ablation on adult development and hematopoiesis. Representative images of wildtype (WT, socs3bwt/wt) and knockout (KO, socs3bmdu24/mdu24) zebrafish at 5 months post fertilization (mpf) (A, B), with scale bars representing 1 cm, along with quantitation of their size showing results for individual fish along with mean and SEM, with significance tested using a parametric t-tests (n = 8) (C). Gene expression analysis of the indicated genes in WT and KO adult kidney presented as fold change (log2) relative to WT, showing mean and SEM. Normalized Cq values obtained from WT and KO kidney marrow was used to test for significance using parametric t-tests (n = 6) (D). Flow cytometry analysis of WT and KO kidney for erythrocyte, lymphocyte, myeloid cell and precursor (E, F) populations, with analysis of mpx+ neutrophils (H, I) and mpeg1.1+ macrophages (K, L) as well as quantitation of relevant populations (G, J, M) showing mean and SEM with significance tested using t-tests with Welch’s correction (n = 10) (*** p < 0.001, ** p < 0.01, * p < 0.05). Histological analysis of adult kidney (N, O) and blood (Q, R), showing representative images, as well as quantitation of both (P, S), showing mean and SEM, a parametric t-tests (n = 6 and n = 8, respectively) (F). Mb, myeloblast; Pro, promyelocyte; M, monocyte; L, lymphocyte; N, neutrophil; E, erythrocyte. |
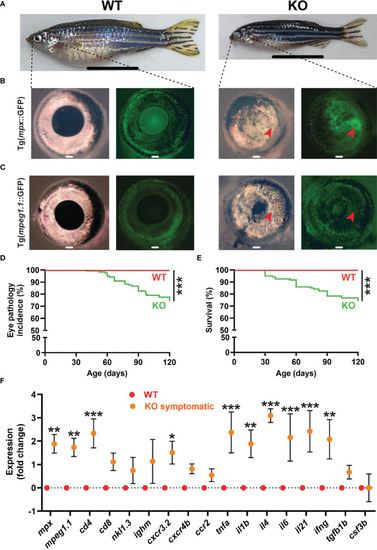
Eye pathology in socs3b KO zebrafish. Representative images of wildtype (WT, socs3bwt/wt) and symptomatic knockout (KO, socs3bmdu24/mdu24) zebrafish on either the Tg(mpx::GFP) (A, B) or Tg(mpeg1.1::GFP) (C) background, with close-up of right eye from respective zebrafish (B, C) under light (left panels) and fluorescence (right panels) microscopy, with scale bar representing 1 cm. Incidence of eye pathology (D) and overall survival (E) in WT and KO zebrafish (n = 25), with significance determined using a log-rank test. Gene expression analysis of WT and symptomatic KO adult eye showing mean and SEM (n = 6) (F). Normalized Cq values obtained from WT and KO eyes was used to test for significance using parametric t-tests (*** p < 0.001, ** p < 0.01, * p < 0.05). |