
- Title
-
Social behavioral profiling by unsupervised deep learning reveals a stimulative effect of dopamine D3 agonists on zebrafish sociality
- Authors
- Geng, Y., Yates, C., Peterson, R.T.
- Source
- Full text @ Cell Rep Methods

The general framework of ZeChat behavioral analysis (A) To analyze a ZeChat recording, a separate video clip is first generated for each fish by cropping out the ZeChat arena in which it is located. Each cropped video clip is orientated so that the transparent window is always aligned to the top edge of the clip. Each frame is then preprocessed to preserve positional, postural, and motion-related information. The preprocessed images are fed into an autoencoder for feature extraction. The main principal components of the extracted feature vector are each converted to a spectrogram by time-frequency analysis. The resulting spectral feature vectors are embedded into a 2-dimensional map and classified to distinct behavioral categories by nonlinear embedding and classification. (B) The 3-dimensional design of the 40-unit ZeChat testing array. (C) A screenshot of ZeChat recording, which is also zoomed in to show an independent testing unit. (D) Intermediate and resulting images of the preprocessing procedure. The fish is first tracked to remove background (tracked). Consecutive tracked frames are subtracted (silhouette). In parallel, the tracked fish is colored by dense optical flow (dense optical flow). Finally, the dense optical flow image is masked by the silhouette to generate a merged image (merge). (E) Training the convolutional autoencoder. Preprocessed images (left, input images) are fed into the 7-layer convolutional autoencoder (middle) to be reconstructed (right, reconstructed images). The encoder layers are responsible for compressing the input image into a latent representation space in the form of a latent vector, which is then used to reconstruct the input image by the decoder layers. (F) Training dataset embedded into a 2-dimensional ZeChat map. A reference map containing 3,000 datapoints (red) was first embedded using t-SNE. Kernel t-SNE was then used to embed an additional 60,000 datapoints (blue). (G) Probability density function (PDF) of the ZeChat map containing 10,000 randomly selected datapoints. Generated by convolving the ZeChat map with a Gaussian. (H) PDF of the ZeChat map was segmented into 80 distinct behavioral categories by performing a watershed transform. |
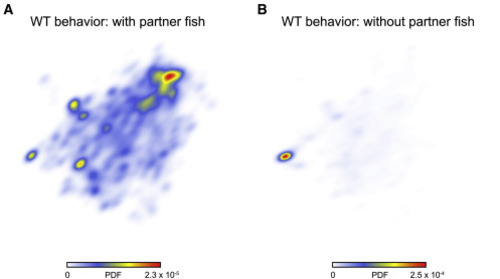
ZeChat map reflects social interactions between partner fish PDF maps of wild-type fish behavior in the presence (A) or absence (B) of a partner fish. n = 10 for both experiments. |

The pause-move dynamic of the ZeChat map (A) A typical datapoint trajectory in the Z1 and Z2 axes of the ZeChat map showing a pause-move dynamic. (B) PDF maps of low-velocity (<1) and high-velocity (≥1) datapoints. The low-velocity datapoints are enriched in distinct positions that closely match the local maxima positions in Figure 1G, whereas the high-velocity datapoints showed a more diffuse distribution pattern. |
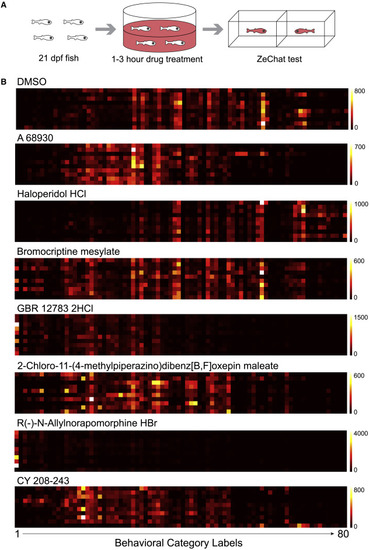
Neuroactive compounds produce highly reproducible behavioral fingerprints (A) A schematic of the screening procedure. (B) Behavioral fingerprints of individual fish treated by different chemicals. Each row represents the behavior fingerprint of an individual fish. Each square represents the total number of times a fish is assigned to a behavioral category. Horizontal axis: the 80 behavioral categories. Color bar: cumulated number of times a fish is assigned to a behavioral category. |

Hierarchical clustering reveals distinct drug-induced behavioral responses Hierarchical clustering of behavioral fingerprints generated by the screen. Each behavioral fingerprint (row) represents the median value of the individual fingerprints of all fish (n ≤ 10 per treatment) treated by the same compound. The behavioral fingerprints are normalized for each behavioral category and subtracted by the median DMSO fingerprint. Horizontal axis labels the 80 behavioral categories. |

Functionally similar molecules evoke similar behavioral responses (A) Neuroactive compounds with similar annotated functions elicit similar behavioral fingerprints. (B) Behavioral fingerprints of functionally similar molecules are consolidated to a single behavioral fingerprint by calculating the median value of each behavioral category, and the resulting behavior fingerprints are hierarchically clustered. Only groups of drugs containing no less than 3 compounds sharing the same annotated function are included in the analysis. The group labels are colored by the targeted pathway. Black arrows point to behavioral fingerprints of dopamine D1, D2, and D3 receptor agonists, respectively. |
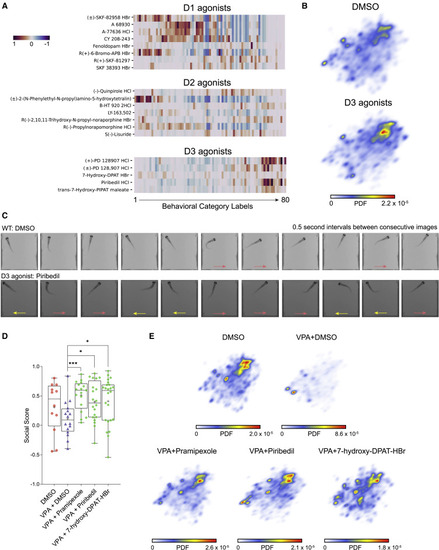
Dopamine D3 agonists rescue social deficits in VPA-treated fish (A) Comparing the behavioral fingerprints of D1, D2, and D3 agonists. The behavioral fingerprints are normalized and subtracted by the median DMSO fingerprint. (B) PDF maps of DMSO-treated fish (n = 356) and fish treated by D3 agonists (n = 49). (C) Series of images taken at 0.5 s intervals reveal different swim dynamics between wild type treated by DMSO and fish treated by the D3 agonist piribedil (10 μM). Arrows in red and yellow point to fish’s direction of movement in the current frame. (D) Boxplot showing social preference (social score) of DMSO-treated fish (n = 12) or VPA-treated fish acutely exposed to DMSO (n = 16) or 10 μM D3 agonist including pramipexole (n = 17), piribedil (n = 20), and 7-hydroxy-DPAT-HBr (n = 24) for 1 h before social preference test. In each boxplot, box encloses datapoints from the 25th percentile to the 75th percentile, the horizontal line and cross mark the median and the mean, and the lines above and below the box reach datapoints with the maximum and minimum values. ∗p < 0.05, ∗∗∗p < 0.001. (E) PDF maps of DMSO-treated fish (n = 10) and VPA-treated fish acutely exposed to DMSO (n = 10) or 10 μM D3 agonist including pramipexole (n = 10), piribedil (n = 10), or 7-hydroxy-DPAT-HBr (n = 10) for 1 h before ZeChat test. |