
- Title
-
Legacy and emerging per- and polyfluoroalkyl substances suppress the neutrophil respiratory burst
- Authors
- Phelps, D.W., Palekar, A.I., Conley, H.E., Ferrero, G., Driggers, J.H., Linder, K.E., Kullman, S.W., Reif, D.M., Sheats, M.K., DeWitt, J.C., Yoder, J.A.
- Source
- Full text @ J Immunotoxicol

Figure 1. PFASs used in this study. Names and structures of the PFASs used in this study. Vendors and CAS-RN numbers are provided in Table 1. Chemical structures were generated with ChemDraw Professional (v16.0.1.4) using International Union of Pure and Applied Chemistry (IUPAC) nomenclature. |

Figure 2. In vivo and in vitro screens. (A) Zebrafish embryos were exposed to several concentrations of different PFASs from ∼6 hpf to 96 hpf. At 96 hpf, larvae were assessed for developmental toxicity or respiratory burst. (B) HL-60 cells were differentiated to a neutrophil-like phenotype (nHL-60) via DMSO treatment for 5 days. At the end of this period, cells were dosed with PFASs and plated into a 96-well plate. At 96 hr post plating, cells were assessed for cytotoxicity or respiratory burst. This strategy was also employed for a 24-hr PFAS exposure. Panel A is adapted from Phelps et al. (2020). Neutrophil images in Panel B were acquired from BioRender. |

Figure 3. PFHxA and GenX suppressed the respiratory burst in vivo at 96 hrs. Zebrafish larvae were exposed for 96 hr to (A) PFOA, (B) PFHxA, (C) GenX, (D) PFOS-K, (E) PFHxS, (F) Nafion byproduct 2, (G) PFNA, (H) PFBS, or (I) PFMOAA-Na. Larvae were then washed and distributed into a 96 well-plate. Larvae were then treated with PMA, to induce ROS production, and H2DCFDA to measure ROS produced. Fluorescence of H2DCFDA was measured for 2.5 hr on a fluorescent plate reader set to 28.5°C. Larvae receiving no PMA and no H2DCFDA were included as controls. Larvae treated with Bis I, a protein kinase C inhibitor, were included as a positive control for inhibition of the respiratory burst. Data shown are from at least three, combined, independent biological replicates with 4-16 larvae/treatment group. Data represent the maximum amount of fluorescence over the entire testing period, with each symbol representing an individual larvae. Statistical significance (*p < 0.05) was determined by a one-way ANOVA with a Dunnett’s post-hoc test for pair-wise comparisons to the vehicle control. AUC measures can be seen in Supplemental Figure S5. Concentration responses are provided in Supplemental Figure S6. |

Figure 4. PFOA, PFHxA, and GenX suppressed the respiratory burst in vitro at 96 hr. After differentiation to nHL-60, cells were exposed to vehicle control or (A) PFOA, (B) PFHxA, (C) GenX, (D) PFOS-K, (E) PFHxS, (F) Nafion byproduct 2, (G) PFNA, (H) PFBS, or (I) PFMOAA-Na for 96 hr. Cells were then plated into a 96 well plate and stimulated with PMA to produce ROS, which was detected with DHR. Maximum fluorescence values are reported here. The entire fluorescence (AUC) values are provided in Supplemental Figure S12. Wells with no cells but with PMA and DHR, and cells receiving no PMA were included as controls. Cells treated with Bis I, a protein kinase C inhibitor, were included as a positive control for inhibition of the respiratory burst. Data shown are from three, combined, independent biological replicates, except for PFHxA, which had four biological replicates. Each biological replicate included eight technical replicates per treatment group. Individual symbols represent individual wells of a 96-well plate. Statistical significance (*p < 0.05) was determined by a one-way ANOVA with a Dunnett’s post-hoc test for pair-wise comparisons to the vehicle control. |

Figure 5. PFHxA and GenX suppressed the respiratory burst in vitro at 24 hr. After differentiation to nHL-60, cells were dosed with vehicle control or (A) PFOA, (B) PFHxA, or (C) GenX and then plated into a 96-well plate. At 24 hr, cells were stimulated with PMA to produce ROS, which was detected with DHR. Maximum fluorescence values are reported here. The entire fluorescence (AUC) values are provided in Supplemental Figure S14. Wells with no cells but with PMA and DHR, and cells receiving no PMA were included as controls. Cells treated with Bis I, a protein kinase C inhibitor, were included as a positive control for inhibition of the respiratory burst. Data shown are from three, combined, independent biological replicates. Each biological replicate included eight technical replicates per treatment group. Individual symbols represent individual wells of a 96-well plate. Statistical significance (*p < 0.05) was determined by a one-way ANOVA with a Dunnett’s post-hoc test for pair-wise comparisons to the vehicle control. |

Figure 6. GenX suppressed the respiratory burst ex vivo at 24 hr. After isolation from individual human donors, neutrophils were dosed with vehicle control, (A) PFHxA, (B) GenX, or (C) PFBS and distributed into a 96 well plate. At 24 hr, cells were stimulated with PMA to produce ROS, which was detected with DHR. Maximum fluorescence values are reported here. The entire fluorescence (AUC) values are provided in Supplemental Figure S18. Fluorescence of DHR was measured for 2.5 hr on a fluorescent plate reader set to 37°C. Wells with no cells but with PMA and DHR, and cells receiving no PMA were included as controls. Cells treated with Bis I, a protein kinase C inhibitor, were included as a positive control for inhibition of the respiratory burst. Data shown are from six human donors (3 male, 3 female). Each biological replicate included 3-6 technical replicates/treatment group. Individual symbols represent individual wells from a 96-well plate. Statistical significance (*p < 0.05) was determined by a two-way ANOVA with a Dunnett’s or Sidak’s post-hoc test for pair-wise comparisons to the vehicle control. |
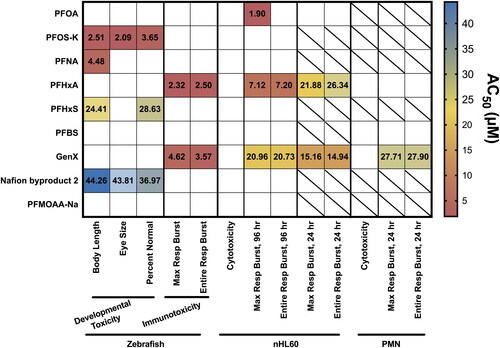
Figure 7. Summary of PFAS impact on zebrafish development, cell viability and respiratory burst in vivo, in vitro and ex vivo. AC50 values of each assay are displayed on a heatmap. Empty squares indicate no statistically significant effect at any dose. Squares with a slash indicate that the test compound was not tested in that assay. AC50 values were calculated as described in the Methods. Concentration response graphs for individual test compounds can be found in the Supplemental Figures. |