
- Title
-
Cpeb1b-mediated cytoplasmic polyadenylation of shha mRNA modulates zebrafish definitive hematopoiesis
- Authors
- Heng, J., Shi, B., Zhou, J.Y., Zhang, Y., Ma, D., Yang, Y.G., Liu, F.
- Source
- Full text @ Proc. Natl. Acad. Sci. USA
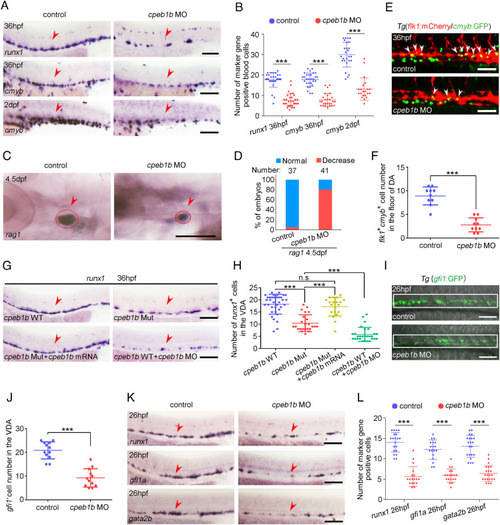
Cpeb1b deficiency impairs HSPC production. (A) Examination of the expression of runx1 and cmyb in the control and cpeb1b morphants by WISH. The red arrowheads denote HSPCs. (Scale bar, 100 μm.) (B) Statistical analysis of the WISH. Error bar, mean ± SD, ***P < 0.001. (C) Examination of the rag1 expression in the control and cpeb1b morphants by WISH. (D) Quantification of the WISH. (E) Confocal imaging shows the flk1+cmyb+ definitive hematopoietic precursors in the VDA region of control and cpeb1b morphants at 36 hpf. White arrowheads denote flk1+cmyb+ precursors. (Scale bars, 100 μm.) (F) Statistical analysis of flk1+cmyb+ definitive hematopoietic precursors. Error bar, mean ± SD. The P value was calculated by Student’s t test, ***P < 0.001. (G) Examination of the runx1 expression in WT, cpeb1b mutant, cpeb1b mRNA-overexpressed cpeb1b mutant, and cpeb1b MO-injected WT embryos by WISH. In WISH experiments using cpeb1b mutant embryos, the embryos were obtained by cross-mating cpeb1b adult mutants and individually subjected to genotyping after WISH for identifying homozygous mutants. (Scale bar, 100 μm.) (H) Statistical analysis of the WISH. Error bar, mean ± SD, n.s.: no significance, ***P < 0.001. (I) Confocal imaging shows the gfi1+ HE cells in the VDA region of control and cpeb1b morphants at 26 hpf. (Scale bars, 100 μm.) (J) Statistical analysis of gfi1+ HE cells. Error bar, mean ± SD. The P value was calculated by Student’s t test, ***P < 0.001. (K) Examination of the HE marker runx1, gfi1a, and gata2b expression in control and cpeb1b morphants at 26 hpf by WISH. (Scale bars, 100 μm.) (L) Statistical analysis of the WISH. Error bar, mean ± SD, ***P < 0.001. |
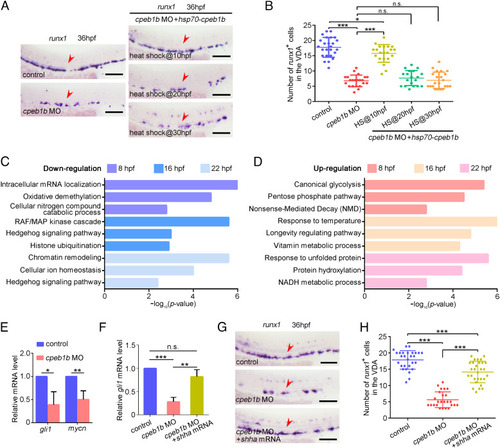
Cpeb1b regulates HSPC development through Hh signaling. (A) Examination of the runx1 expression in the control, cpeb1b morphants, and Cpeb1b-overexpressed cpeb1b morphants by WISH. Cpeb1b overexpression was carried out by hsp70-GFP-cpeb1b HS at 10 hpf or 20 hpf or 30 hpf. The red arrowheads denote HSPCs. (Scale bar, 100 μm.) (B) Statistical analysis of the WISH. Error bar, mean ± SD, n.s.: no significance, *P < 0.05, ***P < 0.001. (C) The LD cpeb1b MO injected WT and cpeb1b mutant embryos at different developmental stages were collected for RNA-seq. The GO analysis showing the downregulated signaling pathways in cpeb1b mutant embryos. (D) GO analysis showing the upregulated signaling pathways in cpeb1b mutant embryos. (E) Relative mRNA level of Shh signaling downstream gene gli1 and mycn in the control and cpeb1b morphants at 16 hpf examined by qRT-PCR. Error bar, mean ± SD. The P value was calculated by Student’s t test, *P < 0.05, **P < 0.01. (F) Relative mRNA level of gli1 in the control, cpeb1b morphants, and shha mRNA-overexpressed cpeb1b morphants at 16 hpf examined by qRT-PCR. Error bar, mean ± SD. The P value was calculated by Student’s t test, n.s.: no significance, **P < 0.01, ***P < 0.001. (G) Examination of the runx1 expression in the control, cpeb1b morphants, and shha mRNA-overexpressed cpeb1b morphants at 36 hpf by WISH. (Scale bar, 100 μm.) (H) Statistical analysis of the WISH. Error bar, mean ± SD, ***P < 0.001. |
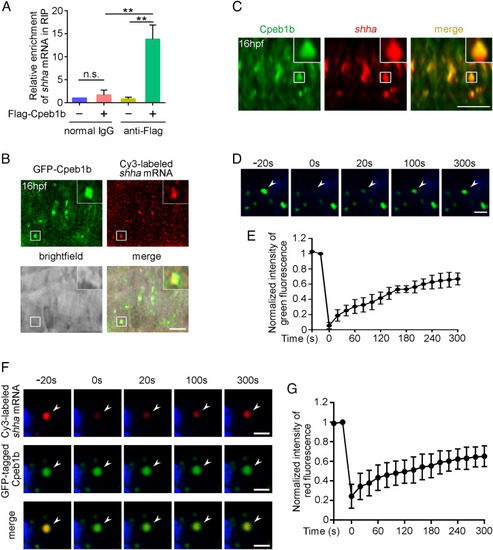
Cpeb1b interacts with shha mRNA in the liquid-like condensates of cytoplasm. (A) Relative mRNA level of shha in normal IgG and anti-Flag groups examined by qRT-PCR. Error bar, mean ± SD. The P value was calculated by Student’s t test, n.s.: no significance, **P < 0.01. (B) Confocal imaging shows colocalization of GFP-Cpeb1b and Cy3-labeled shha mRNA in the notochord of 16 hpf embryos. (Scale bar, 10 μm.) (C) The endogenous shha mRNA was detected by FISH, and the endogenous Cpeb1b was detected by IF using an antibody that can specifically recognize the antigen (444 to 468 amino acids) in Cpeb1b. (Scale bar, 10 μm.) (D) The representative images of fluorescence recovery of GFP-Cpeb1b droplets. (Scale bar, 2 μm.) (E) Relative quantification of fluorescence recovery kinetics of GFP-Cpeb1b droplets. Three condensates were tested, and three condensates were recovered. The lapsed time was 320 s. The black curve shows the mean ± SD (n = 3). (F) The representative images of fluorescence recovery of Cy3-labeled shha mRNA. (Scale bar, 2 μm.) (G) Relative quantification of fluorescence recovery kinetics of Cy3-labeled shha mRNA. Three condensates were tested, and three condensates recovered. The lapsed time was 320 s. The black curve shows the mean ± SD (n = 3). |
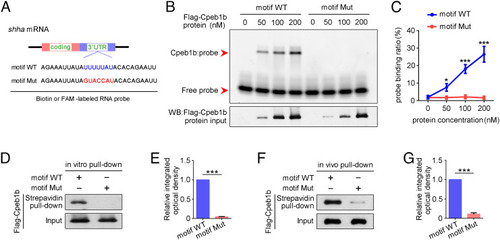
The CPEB motif in shha mRNA is important for Cpeb1b binding. (A) Diagram of biotin or FAM-labeled CPEB motif probe. The WT CPEB binding motif is in blue color, and the mutant CPEB binding motif is in red color. The sequence of motif WT and motif Mut probes is listed. (B) EMSA measuring the Cpeb1b binding with FAM-labeled motif WT and motif Mut probes. The protein concentration ranged from 0 nM to 200 nM. (C) Quantification of each band by gray analysis (Gel-Pro analyzer). The probe binding ratio at each group was determined by (RNA-protein)/[(free RNA) + (RNA-protein)]. GraphPad Prism was used for statistical analysis with Student’s t test. Statistic data were shown as mean ± SD. The P value was used for significance evaluation, *P < 0.05, ***P < 0.001. (D) WB showing the purified Flag-Cpeb1b protein pulled down with biotin-labeled CPEB motif probe. (E) Quantification of relative Flag-Cpeb1b protein level using gray analysis. Error bar, mean ± SD. The P value was calculated by Student’s t test, ***P < 0.001. (F) WB showing the Flag-Cpeb1b protein from Flag-cpeb1b mRNA-injected embryo extracts pulled down with biotin-labeled CPEB motif probe. (G) Quantification of relative Flag-Cpeb1b protein level using gray analysis. Error bar, mean ± SD. The P value was calculated by Student’s t test, ***P < 0.001. |
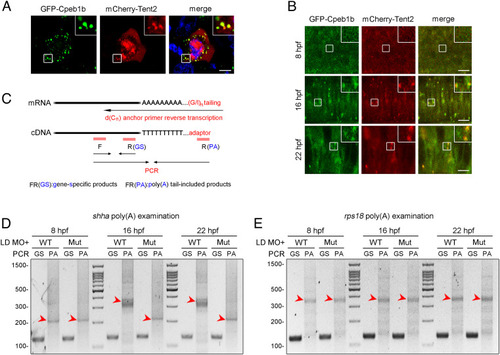
Cpeb1b regulates cytoplasmic polyadenylation of shha mRNA. (A) Confocal imaging shows colocalization of GFP-Cpeb1b and mCherry-Tent2 in the cytoplasm of HEK293T cells. (Scale bar, 10 μm.) (B) Confocal imaging shows that GFP-Cpeb1b colocalizes with mCherry-Tent2 in the condensates in the notochord of 16 and 22 hpf embryos but not in the hypoblast of 8 hpf embryos. (Scale bar, 10 μm.) (C) Outline of the PAT assay. Cytoplasmic RNA extracted from the embryos was subjected to G/I tailing. The complementary DNA was synthesized by reverse transcription using the poly(G/I) tailed RNA as template. Then, the specific PCR products were synthesized by specific primers and detected by gel electrophoresis. GS: gene-specific products, PA: poly(A) tail-included products. (D) Examination of the poly(A) length of shha mRNA in the LD cpeb1b MO-injected WT and cpeb1b mutant embryos (elimination of maternal effects) at different developmental stages by PAT assay. The PCR products were detected by gel electrophoresis. The red arrowheads denote smear bands from poly(A) PCR products. (E) Examination of the poly(A) length of rps18 mRNA in the LD cpeb1b MO-injected WT and cpeb1b mutant embryos at different developmental stages. The red arrowheads denote smear bands from poly(A) PCR products. |
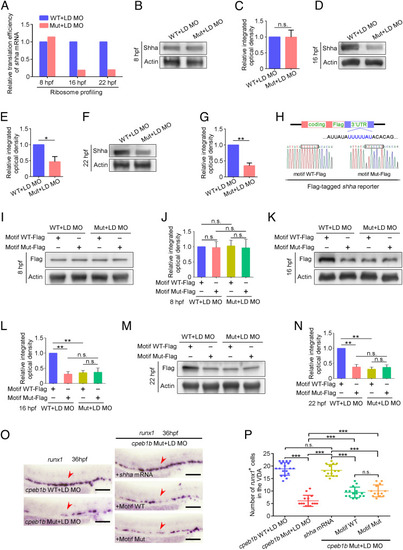
Cpeb1b regulates translation of shha mRNA. (A) Relative translation efficiency of shha mRNA in the LD cpeb1b MO injected WT and cpeb1b mutant embryos examined by ribosome profiling. (B) Protein level of endogenous Shha and Actin in the LD cpeb1b MO-injected WT and cpeb1b mutant embryos at 8 hpf examined by WB. (C) Quantification of relative Shha protein level using gray analysis. Two replicates, error bar, mean ± SD. The P value was calculated by Student’s t test, n.s.: no significance. (D) Protein level of endogenous Shha and Actin in the LD cpeb1b MO-injected WT and cpeb1b mutant embryos at 16 hpf examined by WB. (E) Quantification of relative Shha protein level using gray analysis. Two replicates, error bar, mean ± SD. The P value was calculated by Student’s t test, **P < 0.01. (F) Protein level of endogenous Shha and Actin in the LD cpeb1b MO-injected WT and cpeb1b mutant embryos at 22 hpf examined by WB. (G) Quantification of relative Shha protein level using gray analysis. Two replicates, error bar, mean ± SD. The P value was calculated by Student’s t test, *P < 0.05. (H) Diagram of Flag-tagged shha reporter. The CPEB binding motif is in blue color, and partial sequence of the motif WT and motif Mut reporters is listed. (I) Protein level of Shha-Flag and Actin in Motif WT-Flag or Motif Mut-Flag overexpressed WT and cpeb1b mutant embryos at 8 hpf examined by WB. Elimination of maternal effects was carried out by the LD cpeb1b MO injection. (J) Quantification of relative Shha-Flag protein level using gray analysis. Two replicates, error bar, mean ± SD. The P value was calculated by Student’s t test, n.s.: no significance. (K) Protein level of Shha-Flag and Actin in Motif WT-Flag or Motif Mut-Flag overexpressed WT and cpeb1b mutant embryos at 16 hpf examined by WB. (L) Quantification of relative Shha-Flag protein level using gray analysis. Two replicates, error bar, mean ± SD. The P value was calculated by Student’s t test, n.s.: no significance, **P < 0.01. (M) Protein level of Shha-Flag and Actin in Motif WT-Flag or Motif Mut-Flag overexpressed WT and cpeb1b mutant embryos at 22 hpf examined by WB. (N) Quantification of relative Shha-Flag protein level using gray analysis. Two replicates, error bar, mean ± SD. The P value was calculated by Student’s t test, n.s.: no significance, **P < 0.01. (O) Examination of the expression of runx1 by WISH. The red arrowheads denote HSPCs. LD: a low dose of cpeb1b MO injection. In HSPC phenotype rescue experiments using cpeb1b mutant embryos, these embryos were obtained by cross-mating cpeb1b adult mutants and individually subjected to genotyping after WISH experiment for identifying homozygous mutants. (Scale bar, 100 μm.) (P) Statistical analysis of the WISH. Error bar, mean ± SD, n.s.: no significance, ***P < 0.001. |
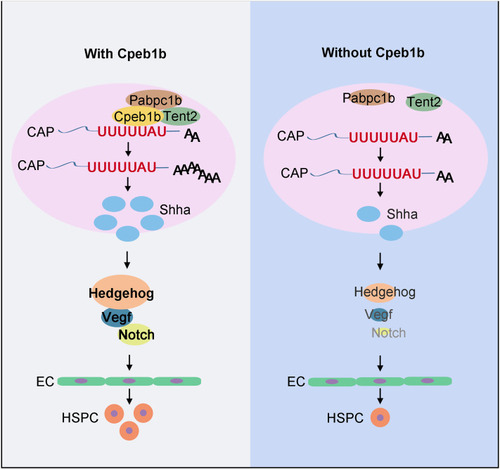
Schematic diagram showing that Cpeb1b modulates HSPCs development via cytoplasmic polyadenylation of shha mRNA. Cpeb1b-mediated cytoplasmic polyadenylation of shha mRNA is important for enhancing its translation efficiency and therefore increases the Shha protein level. An increase in the number of Shha protein is required for definitive hematopoiesis by regulating Hedgehog–Vegf–Notch signaling axis. In the absence of Cpeb1b, the Shha protein level is reduced, which results in downregulation of Hedgehog–Vegf–Notch signaling axis, further leading to definitive hematopoiesis defect. |