
|
Fig. 2.
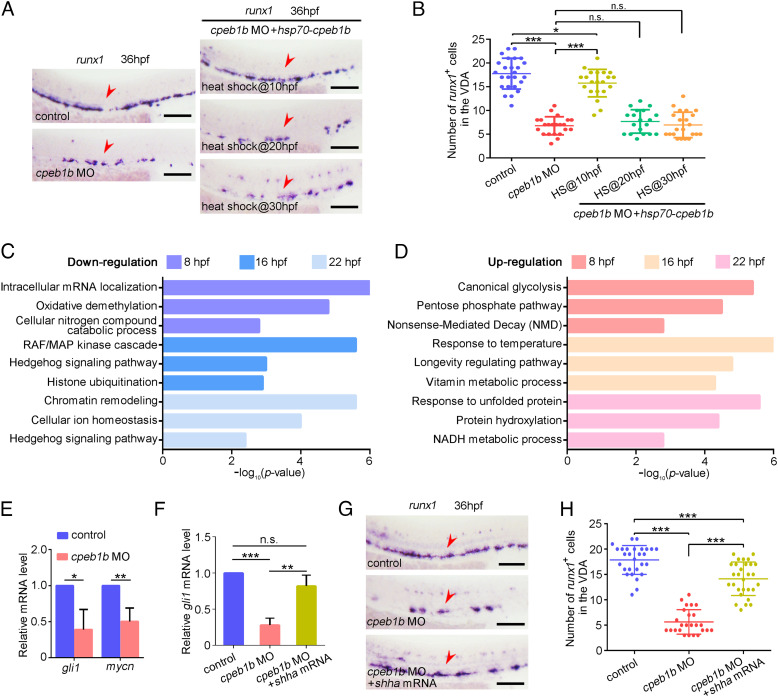
Cpeb1b regulates HSPC development through Hh signaling. (A) Examination of the runx1 expression in the control, cpeb1b morphants, and Cpeb1b-overexpressed cpeb1b morphants by WISH. Cpeb1b overexpression was carried out by hsp70-GFP-cpeb1b HS at 10 hpf or 20 hpf or 30 hpf. The red arrowheads denote HSPCs. (Scale bar, 100 μm.) (B) Statistical analysis of the WISH. Error bar, mean ± SD, n.s.: no significance, *P < 0.05, ***P < 0.001. (C) The LD cpeb1b MO injected WT and cpeb1b mutant embryos at different developmental stages were collected for RNA-seq. The GO analysis showing the downregulated signaling pathways in cpeb1b mutant embryos. (D) GO analysis showing the upregulated signaling pathways in cpeb1b mutant embryos. (E) Relative mRNA level of Shh signaling downstream gene gli1 and mycn in the control and cpeb1b morphants at 16 hpf examined by qRT-PCR. Error bar, mean ± SD. The P value was calculated by Student’s t test, *P < 0.05, **P < 0.01. (F) Relative mRNA level of gli1 in the control, cpeb1b morphants, and shha mRNA-overexpressed cpeb1b morphants at 16 hpf examined by qRT-PCR. Error bar, mean ± SD. The P value was calculated by Student’s t test, n.s.: no significance, **P < 0.01, ***P < 0.001. (G) Examination of the runx1 expression in the control, cpeb1b morphants, and shha mRNA-overexpressed cpeb1b morphants at 36 hpf by WISH. (Scale bar, 100 μm.) (H) Statistical analysis of the WISH. Error bar, mean ± SD, ***P < 0.001.