
|
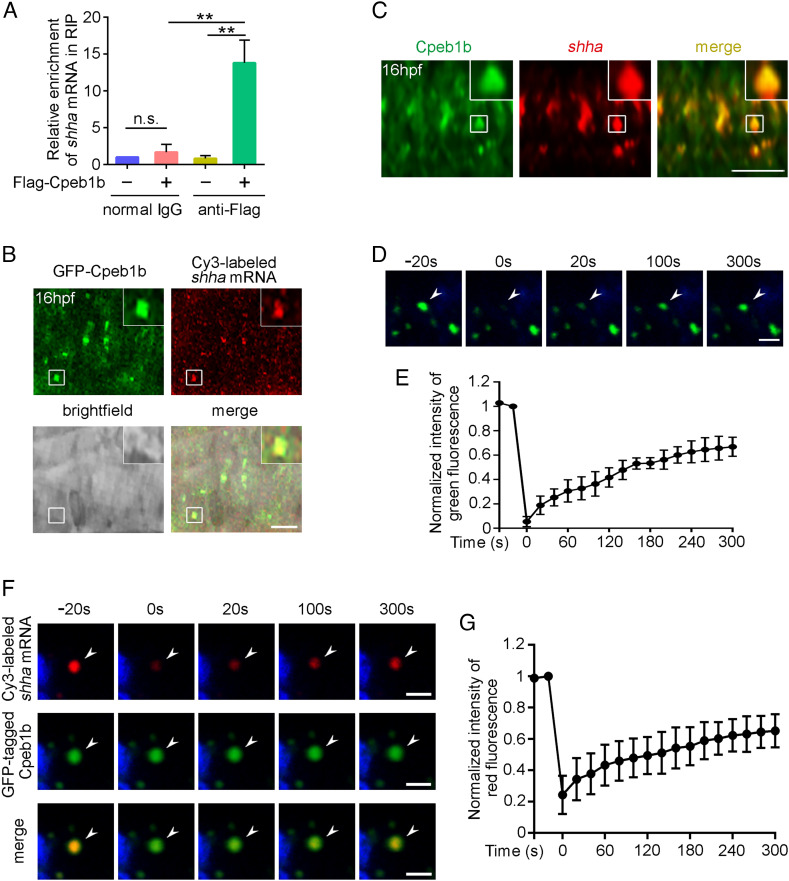
Fig. 3.
Cpeb1b interacts with shha mRNA in the liquid-like condensates of cytoplasm. (A) Relative mRNA level of shha in normal IgG and anti-Flag groups examined by qRT-PCR. Error bar, mean ± SD. The P value was calculated by Student’s t test, n.s.: no significance, **P < 0.01. (B) Confocal imaging shows colocalization of GFP-Cpeb1b and Cy3-labeled shha mRNA in the notochord of 16 hpf embryos. (Scale bar, 10 μm.) (C) The endogenous shha mRNA was detected by FISH, and the endogenous Cpeb1b was detected by IF using an antibody that can specifically recognize the antigen (444 to 468 amino acids) in Cpeb1b. (Scale bar, 10 μm.) (D) The representative images of fluorescence recovery of GFP-Cpeb1b droplets. (Scale bar, 2 μm.) (E) Relative quantification of fluorescence recovery kinetics of GFP-Cpeb1b droplets. Three condensates were tested, and three condensates were recovered. The lapsed time was 320 s. The black curve shows the mean ± SD (n = 3). (F) The representative images of fluorescence recovery of Cy3-labeled shha mRNA. (Scale bar, 2 μm.) (G) Relative quantification of fluorescence recovery kinetics of Cy3-labeled shha mRNA. Three condensates were tested, and three condensates recovered. The lapsed time was 320 s. The black curve shows the mean ± SD (n = 3).