
Fig. 6.
- ID
- ZDB-FIG-230228-89
- Publication
- Heng et al., 2023 - Cpeb1b-mediated cytoplasmic polyadenylation of shha mRNA modulates zebrafish definitive hematopoiesis
- Other Figures
- All Figure Page
- Back to All Figure Page
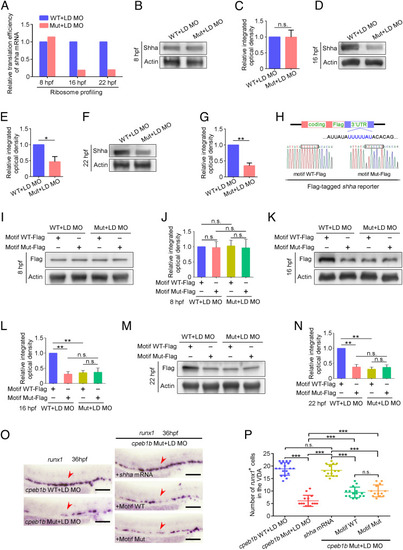
Cpeb1b regulates translation of shha mRNA. (A) Relative translation efficiency of shha mRNA in the LD cpeb1b MO injected WT and cpeb1b mutant embryos examined by ribosome profiling. (B) Protein level of endogenous Shha and Actin in the LD cpeb1b MO-injected WT and cpeb1b mutant embryos at 8 hpf examined by WB. (C) Quantification of relative Shha protein level using gray analysis. Two replicates, error bar, mean ± SD. The P value was calculated by Student’s t test, n.s.: no significance. (D) Protein level of endogenous Shha and Actin in the LD cpeb1b MO-injected WT and cpeb1b mutant embryos at 16 hpf examined by WB. (E) Quantification of relative Shha protein level using gray analysis. Two replicates, error bar, mean ± SD. The P value was calculated by Student’s t test, **P < 0.01. (F) Protein level of endogenous Shha and Actin in the LD cpeb1b MO-injected WT and cpeb1b mutant embryos at 22 hpf examined by WB. (G) Quantification of relative Shha protein level using gray analysis. Two replicates, error bar, mean ± SD. The P value was calculated by Student’s t test, *P < 0.05. (H) Diagram of Flag-tagged shha reporter. The CPEB binding motif is in blue color, and partial sequence of the motif WT and motif Mut reporters is listed. (I) Protein level of Shha-Flag and Actin in Motif WT-Flag or Motif Mut-Flag overexpressed WT and cpeb1b mutant embryos at 8 hpf examined by WB. Elimination of maternal effects was carried out by the LD cpeb1b MO injection. (J) Quantification of relative Shha-Flag protein level using gray analysis. Two replicates, error bar, mean ± SD. The P value was calculated by Student’s t test, n.s.: no significance. (K) Protein level of Shha-Flag and Actin in Motif WT-Flag or Motif Mut-Flag overexpressed WT and cpeb1b mutant embryos at 16 hpf examined by WB. (L) Quantification of relative Shha-Flag protein level using gray analysis. Two replicates, error bar, mean ± SD. The P value was calculated by Student’s t test, n.s.: no significance, **P < 0.01. (M) Protein level of Shha-Flag and Actin in Motif WT-Flag or Motif Mut-Flag overexpressed WT and cpeb1b mutant embryos at 22 hpf examined by WB. (N) Quantification of relative Shha-Flag protein level using gray analysis. Two replicates, error bar, mean ± SD. The P value was calculated by Student’s t test, n.s.: no significance, **P < 0.01. (O) Examination of the expression of runx1 by WISH. The red arrowheads denote HSPCs. LD: a low dose of cpeb1b MO injection. In HSPC phenotype rescue experiments using cpeb1b mutant embryos, these embryos were obtained by cross-mating cpeb1b adult mutants and individually subjected to genotyping after WISH experiment for identifying homozygous mutants. (Scale bar, 100 μm.) (P) Statistical analysis of the WISH. Error bar, mean ± SD, n.s.: no significance, ***P < 0.001. |