
- Title
-
Exposure to an environmentally relevant concentration of 17α-ethinylestradiol disrupts craniofacial development of juvenile zebrafish
- Authors
- Stewart, M.K., Hoehne, L., Dudczig, S., Mattiske, D.M., Pask, A.J., Jusuf, P.R.
- Source
- Full text @ Ecotoxicol. Environ. Saf.
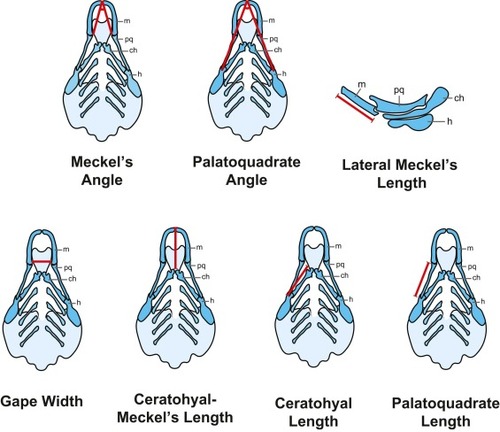
Fig. 1. Diagrammatic representation of craniofacial measurements used for Alcian blue stained zebrafish. Red lines indicate the relevant lengths and angles measured. m = meckel’s; pq = palatoquadrate; ch = ceratohyal; h = hyosymplectic. |
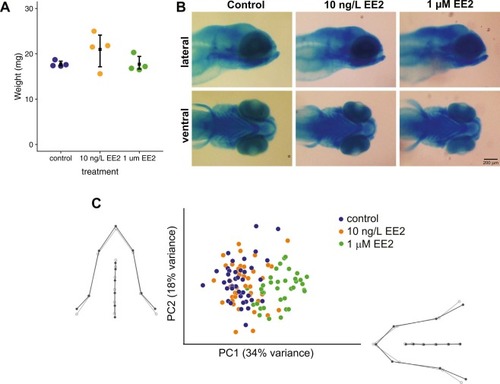
Fig. 2. Effects of exposure of AB zebrafish embryo-larvae to either 10 ng/L or 1 µM EE2 from 15 hpf–5 dpf on weight and craniofacial structure. Weight (mg) of all larvae in control and EE2 treatment groups (50 per group, n = 4) (A). Representative lateral and ventral images of 5 dpf Alcian blue stained zebrafish in control, 10 ng/L EE2, and 1 µM EE2 groups (B). Principal component analysis of zebrafish larvae craniofacial structures in each treatment group (C). Wireframe graphs are shown on each axis. Light grey indicates the mean shape and dark grey indicates the shape change in a positive direction of the relevant PC. |

Fig. 3. Craniofacial measurements of 5 dpf AB zebrafish larvae in each treatment group. Plots showing Meckel’s angle (A), Palatoquadrate angle (B), Lateral Meckel’s length (C), Ceratohyal-Meckel’s length (D), Ceratohyal length (E) and Palatoquadrate length (F) values of the three treatment groups (control, 10 ng/L or 1 µM EE2). Middle black line indicates the mean, and the upper and lower lines indicate the 95 % confidence interval of the mean. Visual representation of each measurement is shown in Fig. 1. ** p ≤ 0.01, *** p ≤ 0.001, **** p ≤ 0.0001. |

Fig. 4. Effects of prolonged exposure of larvae-juvenile AB zebrafish from 15 dpf – 7 mm to 10 ng/L EE2. Representative lateral and ventral images of Alcian blue and Alizarin red stained juvenile zebrafish in control and EE2 treated groups (A). Plot showing weight (mg) of individual juvenile zebrafish in control and EE2 treated groups (B). Middle black line indicates the mean, and the upper and lower lines indicate the 95 % confidence interval of the mean, * ** p ≤ 0.001. Principal component analysis of juvenile zebrafish craniofacial structures in each treatment group (C). Wireframe graphs are shown on each axis. Orange indicates the mean shape and blue indicates the shape change in a positive direction of the relevant PC. Plot of PC1 and weight (mg) in juvenile zebrafish to assess correlation between jaw phenotype and weight (D). |
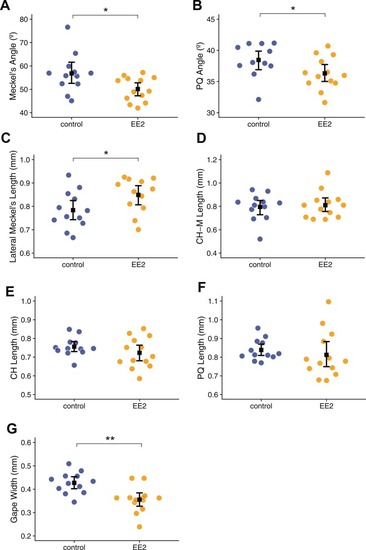
Fig. 5. Prolonged exposure of AB zebrafish to 10 ng/L of EE2 from 15 dpf – 7 mm causes changes to craniofacial morphology. Plots showing Meckel’s angle (A), Palatoquadrate angle (B), Lateral Meckel’s length (C), Ceratohyal-Meckel’s length (D), Ceratohyal length (E) and Palatoquadrate length (F) and gape width (G) in control and EE2 treated fish. Visual representation of each measurement is shown in Fig. 1. |