
- Title
-
Development of a Zebrafish Larvae Model for Diabetic Heart Failure With Reduced Ejection Fraction
- Authors
- Kim, I., Seok, S.H., Lee, H.Y.
- Source
- Full text @ Korean Circ J
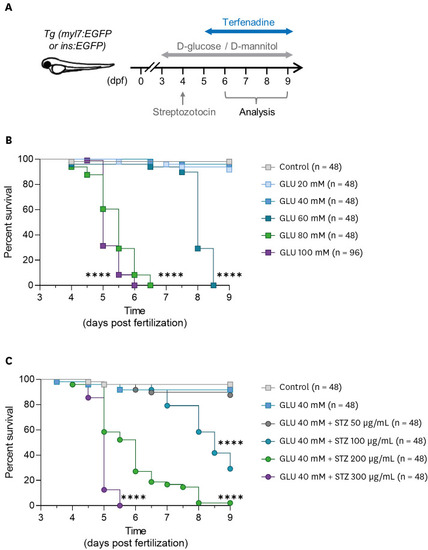
Effects of various concentrations of GLU and/or STZ on the survival rates and motility of zebrafish larvae. (A) Schematic of the study design. (B) Kaplan-Meier survival analysis of zebrafish larvae after treatment with various concentrations of GLU (n = 48 per group) and (C) a combination of 40 mM GLU and various concentrations of STZ. (n = 48 per group).
GLU = D-glucose; STZ = streptozotocin. ****p<0.0001 vs. (B) control group or (C) GLU 40 mM group. |
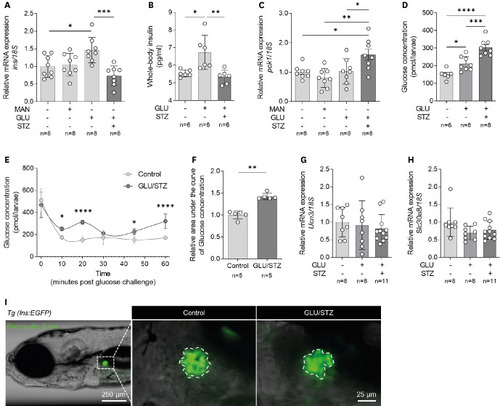
Induction of diabetes mellitus-like phenotypes in zebrafish larvae via combined treatment with GLU and STZ. (A) Relative mRNA expression of ins (n = 8 per group) and (B) Whole-body insulin level (n = 6 per group). (C) Relative mRNA expression of pck1 (n = 8 per group). (D) Whole-body glucose concentration (n = 6–8 per group). (E) Changes in whole-body glucose concentration after high-GLU challenge and (F) the corresponding AUC (n = 5 per group). (G) Relative gene expression of Ucn3 and (H) Slc30a8 (n = 8–11 per group). (I) Representative fluorescence microscopic image of pancreatic β-cells of the Tg (ins:EGFP) zebrafish larvae. Each group had 6–11 samples, with (A, B, and D-H) 10 or (C) 30 larvae per sample. Data are presented as mean ± standard deviation and each dot represents the value of each sample.
AUC = area under the curve; GLU = D-glucose; MAN = D-mannitol; STZ = streptozotocin; Tg = transgenic; EGFP = enhanced green fluorescent protein. *p<0.05, **p<0.01, ***p<0.001, ****p<0.0001 vs. indicated group. |
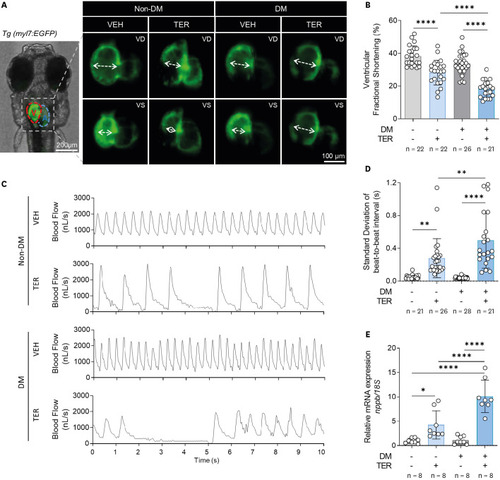
HF phenotype induced by TER in the DM zebrafish model. (A) Representative fluorescent microscopic images of the Tg (myl7:EGFP) zebrafish heart with a GFP at 7 dpf. (B) vFS (n = 21–26 per group). (C) Representative blood pulse graphs. (D) SD of the beat-to-beat interval (n = 21–28 per group). (E) Relative mRNA expression of nppb (n = 8 per group). Each group had 8 samples, with 10 larvae per sample. Data are presented as mean ± SD and each dot represents the value of each sample.
DM = diabetes mellitus; dpf = days post-fertilization; EGFP = enhanced green fluorescent protein; HF = heart failure; myl7 = myosin light chain 7; SD = standard deviation; TER = terfenadine; Tg = transgenic; VD = ventricular diastole; VEH = vehicle; VS = ventricular systole. *p<0.05, **p<0.01, ****p<0.0001 vs. indicated group. |
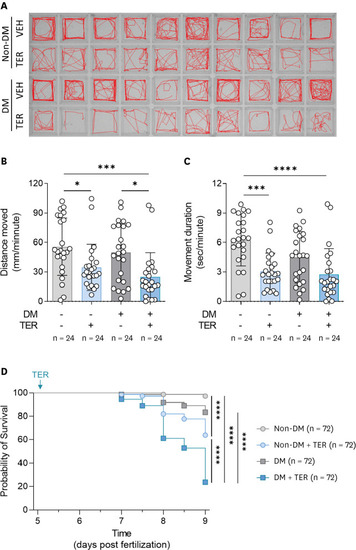
Reduced motility and viability of the diabetic HF zebrafish model. (A) Representative images of motility tracking for 5 minutes in zebrafish larvae. (B) Average moved distance and (C) movement duration per minute (n = 24 per group). Data are presented as mean ± SD and each dot represents the value of each sample. (D) Kaplan-Meier survival analysis (n = 72 per group).
DM = diabetes mellitus; TER = terfenadine; VEH = vehicle. *p<0.05, ***p<0.001, ****p<0.0001 vs. indicated group. PHENOTYPE:
|