
FIGURE
Fig. 3
- ID
- ZDB-FIG-230615-20
- Publication
- Kim et al., 2023 - Development of a Zebrafish Larvae Model for Diabetic Heart Failure With Reduced Ejection Fraction
- Other Figures
- All Figure Page
- Back to All Figure Page
Fig. 3
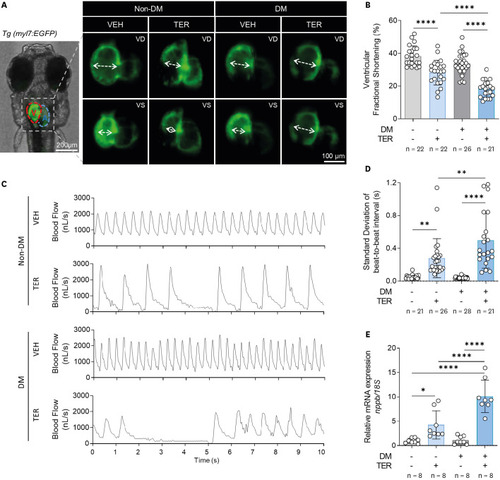
HF phenotype induced by TER in the DM zebrafish model. (A) Representative fluorescent microscopic images of the Tg (myl7:EGFP) zebrafish heart with a GFP at 7 dpf. (B) vFS (n = 21–26 per group). (C) Representative blood pulse graphs. (D) SD of the beat-to-beat interval (n = 21–28 per group). (E) Relative mRNA expression of nppb (n = 8 per group). Each group had 8 samples, with 10 larvae per sample. Data are presented as mean ± SD and each dot represents the value of each sample.
DM = diabetes mellitus; dpf = days post-fertilization; EGFP = enhanced green fluorescent protein; HF = heart failure; myl7 = myosin light chain 7; SD = standard deviation; TER = terfenadine; Tg = transgenic; VD = ventricular diastole; VEH = vehicle; VS = ventricular systole. *p<0.05, **p<0.01, ****p<0.0001 vs. indicated group. |
Expression Data
| Gene: | |
|---|---|
| Fish: | |
| Conditions: | |
| Anatomical Term: | |
| Stage: | Days 7-13 |
Expression Detail
Antibody Labeling
Phenotype Data
| Fish: | |
|---|---|
| Conditions: | |
| Observed In: | |
| Stage: | Days 7-13 |
Phenotype Detail
Acknowledgments
This image is the copyrighted work of the attributed author or publisher, and
ZFIN has permission only to display this image to its users.
Additional permissions should be obtained from the applicable author or publisher of the image.
Full text @ Korean Circ J