
IMAGE
Fig. 2
Image
|
Figure Caption
Fig. 2
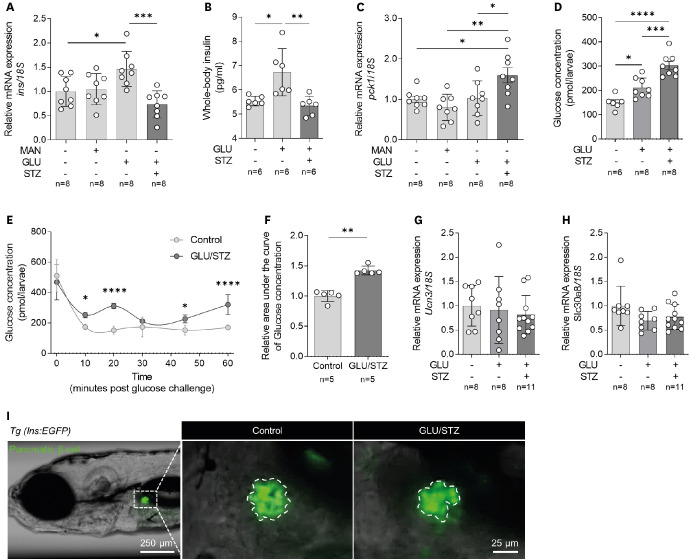
Induction of diabetes mellitus-like phenotypes in zebrafish larvae via combined treatment with GLU and STZ. (A) Relative mRNA expression of ins (n = 8 per group) and (B) Whole-body insulin level (n = 6 per group). (C) Relative mRNA expression of pck1 (n = 8 per group). (D) Whole-body glucose concentration (n = 6–8 per group). (E) Changes in whole-body glucose concentration after high-GLU challenge and (F) the corresponding AUC (n = 5 per group). (G) Relative gene expression of Ucn3 and (H) Slc30a8 (n = 8–11 per group). (I) Representative fluorescence microscopic image of pancreatic β-cells of the Tg (ins:EGFP) zebrafish larvae. Each group had 6–11 samples, with (A, B, and D-H) 10 or (C) 30 larvae per sample. Data are presented as mean ± standard deviation and each dot represents the value of each sample.
AUC = area under the curve; GLU = D-glucose; MAN = D-mannitol; STZ = streptozotocin; Tg = transgenic; EGFP = enhanced green fluorescent protein.
*p<0.05, **p<0.01, ***p<0.001, ****p<0.0001 vs. indicated group.
Figure Data
Acknowledgments
This image is the copyrighted work of the attributed author or publisher, and
ZFIN has permission only to display this image to its users.
Additional permissions should be obtained from the applicable author or publisher of the image.
Full text @ Korean Circ J