
- Title
-
Localized heterochrony integrates overgrowth potential of oncogenic clones
- Authors
- Blum, N., Harris, M.P.
- Source
- Full text @ Dis. Model. Mech.

Mosaic overactivation of the PI3K/AKT pathway causes fin long bone overgrowth in zebrafish. (A) Leg length discrepancy due to overgrowth of the right tibia and fibula (marked by asterisks) in a patient with Proteus syndrome. (B) Macrodactyly in a patient diagnosed with PROS. Images in A and B were modified from Zeng et al. (2020) and Tian et al. (2020), respectively, under the terms of the original CC-BY 4.0 license. (C) Generalized diagram of the adult zebrafish axial skeleton. Long bones of the median fin endoskeleton are highlighted in magenta. (D) Schematic of the experimental design to generate mosaic zebrafish harboring clones with oncogenic PI3K/AKT signaling. (E,F) Representative stereomicroscope images of fin long bone overgrowth observed in akt1E18K-GFP and myr-p110-GFP mosaic fish. Alizarin Red-stained preparations of caudal (E) and anal (F) fin endoskeleton. Asterisks mark overgrown bones. Scale bars: 0.1 cm. |

Long bone overgrowth is caused by PI3K/AKT overactivation in mesenchymal derivatives. PI3K/AKT mosaic overactivation results in an early overgrowth phenotype in the fin endoskeleton. (A,B) In vivo confocal imaging of chondrocytes (A) marked by Tg(sox10:DsRed) (magenta) and osteoblasts (B) marked by Tg(sp7:mCherry) (magenta) in late larval stages reveals localized skeletal overgrowth in median fins of akt1E18K-GFP (green) and myr-p110-GFP (green) mosaic larva overlapping with GFP+ cells. Boxed areas are at high magnification, showing that akt1E18K-GFP and myr-p110-GFP colocalize with chondrocytes and osteoblasts. Asterisks indicate overgrown bones. Arrowheads indicate GFP+ chondrocytes in A and GFP+ osteoblasts in B. SL, standard length in mm. Scale bars: 100 μm; high-magnification images: 25 μm. |
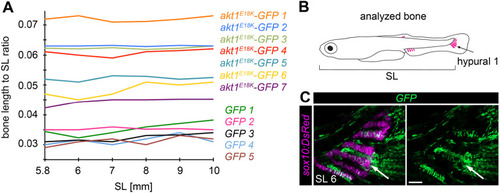
Long bone overgrowth is non-progressive. Overgrown long bones in akt1E18K-GFP mosaic larvae elongate at the same rate as bones in control larvae. (A) Ratio of the length of endochondral bone hypural 1 to SL over time (SL 5.8-10 mm) in akt1E18K-GFP (n=7) and GFP (n=5) mosaic larvae. (B) Analyzed bone (GFP+ hypural 1 of the caudal fin). (C) Representative in vivo confocal image of the caudal fin of an analyzed GFP (green) mosaic larva. Tg(sox10:DsRed) marks chondrocytes (magenta). Arrows mark hypural 1. SL, standard length in mm. Scale bar: 50 μm. |
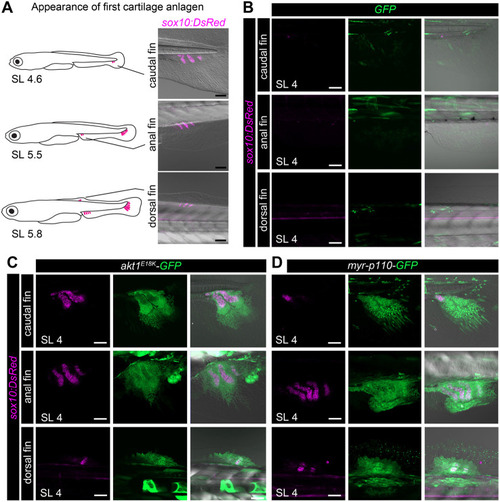
PI3K/AKT mutant clones induce a heterochronic shift in long bone development. (A) Schematic representation and in vivo confocal imaging of first cartilage anlagen [marked by Tg(sox10:DsRed) (magenta)] in caudal, anal and dorsal fins. (B-D) In vivo confocal imaging of chondrocytes [Tg(sox10:DsRed) (magenta)] at SL 4 mm in GFP (green) (B), akt1E18K-GFP (green) (C) and myr-p110-GFP (green) (D) mosaic larvae reveals premature formation of cartilage anlagen in median fins of akt1E18K-GFP and myr-p110-GFP larvae. SL, standard length in mm. Scale bars: 50 μm. |
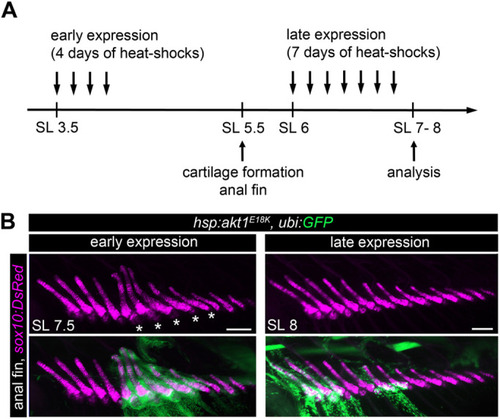
akt1E18K mosaic expression restricted to early larval stages is sufficient to cause long bone overgrowth. (A) Schematic of the experimental design to analyze the temporal requirement of PI3K/AKT overactivation in long bone overgrowth. (B) Representative in vivo confocal images of the anal fin endoskeleton [chondrocytes are marked by Tg(sox10:DsRed) (magenta)] in hsp:aktE18K, ubi:GFP (green) mosaic larva. Heat-shock induced akt1E18K expression prior to cartilage formation (early expression) caused overgrowth in clone-harboring long bones. In contrast, bone size was unaffected if akt1E18K was expressed post cartilage formation (late expression). Asterisks mark overgrown bones. SL, standard length in mm. Scale bars: 100 μm. |

akt1E18K mutant mesenchymal clones form premature pre-chondrogenic condensations. (A) In vivo confocal imaging of akt1E18K-GFP (green) mesenchymal clones at SL 3.7 mm reveals clonal expansion and premature pre-chondrogenic condensation in the caudal fin. Arrowhead marks the edge of condensation. (B,C) akt1E18K-GFP mesenchymal clones in the larval fin are hyperproliferative. (B) Quantification of mesenchymal cells expressing GFP or akt1E18K-GFP labeled with 5-ethynyl-2′-deoxyuridine (EdU) to assay DNA synthesis in the caudal fin. Data are represented as mean±s.e.m. n=number of analyzed fish. (C) Representative in vivo confocal images of EdU (magenta) labeling in the caudal fin of GFP (green) and akt1E18K-GFP (green) mosaic larvae at SL 3.5 mm. Arrowhead marks akt1E18K-GFP-expressing EdU-positive cells. Arrow marks EdU-positive wild type cells. SL, standard length in mm. Scale bars: 50 μm. |

Model for long bone overgrowth in PROS and Proteus syndrome. Developmental mechanism underlying localized skeletal gigantism caused by somatic oncogenic mutations in the PI3K/AKT pathway. Long bones of the anal fin endoskeleton are highlighted in magenta. |