
- Title
-
Uricase-Deficient Larval Zebrafish with Elevated Urate Levels Demonstrate Suppressed Acute Inflammatory Response to Monosodium Urate Crystals and Prolonged Crystal Persistence
- Authors
- Linnerz, T., Sung, Y.J., Rolland, L., Astin, J.W., Dalbeth, N., Hall, C.J.
- Source
- Full text @ Genes (Basel)
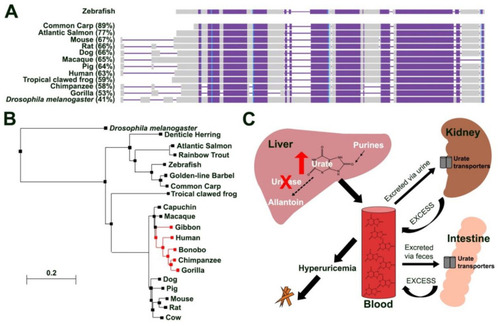
Zebrafish uricase is highly conserved. (A) Schematic illustrating amino acid conservation between zebrafish Uox with urate oxidases from other fish species (common carp (Cyprinus carpio carpio), Atlantic salmon (Salmo salar)), rodents (mouse (Mus musculus) and rat (Rattus norvegicus)), tropical clawed frog (Xenopus tropicalis), dog (Canis lupus familiaris), pig (Sus scrofa), primates (macaque (Macaca mulatta), gorilla (Gorilla gorilla gorilla), chimpanzee (Pan troglodytes), human (Homo sapiens)) and Drosophila melanogaster (percentages show amino acid conservation with zebrafish Uox). Alignment columns with no gaps are coloured in blue and violet. Violet colour indicates highly conserved regions (same residue in all alignment rows) and blue indicates less conserved regions. Unaligned residues are shown in grey. (B) Phylogenetic analysis of zebrafish Uox using BLASTP and the neighbour joining method with a Grishin distance model. Species lacking a functional uricase protein are highlighted in red. (C) Schematic illustrating urate metabolism in humans (that lack a functional urate oxidase (uricase) protein) and the contribution of hyperuricemia to MSU crystal formation. Purines are catabolized in the liver to urate, which is further degraded into allantoin in the presence of a functional uricase protein. Higher primates (including humans) lack a functional uricase making them sensitive to developing hyperuricemia, a risk factor for MSU crystal deposition and gout. Due to its water-insoluble properties, excess urate from the excretory pathway (kidney and intestines) is released back into the blood stream. |
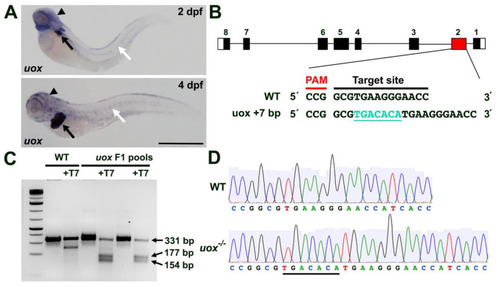
Generating a zebrafish uox mutant. (A) Expression of uox in 2 and 4 day post fertilization (dpf) larvae, as detected by WMISH (black arrows and arrowheads mark liver and head expression, respectively. White arrows mark horizontal myoseptum expression). (B) Schematic illustrating the intron (black line) and exon (black rectangles) structure of uox (with flanking UTRs as white rectangles). The position (red rectangle) of the CRISPR/Cas9 target site and the sequence are annotated, with the +7 indel mutation shown in green. (C) T7 endonuclease I assay (with and without T7 endonuclease) on pools of WT and F1 embryos. Successful editing is indicated by the cleavage products of 177 bp and 154 bp. (D) Sequencing chromatogram of amplicons from WT uox compared to a homozygous carrier of the +7 bp uox mutation (underlined). Scale bar: 500 µm. |
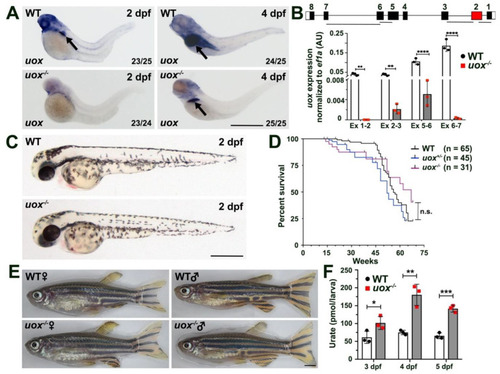
The +7 bp mutation in the uox gene results a null allele and uox−/− zebrafish are morphologically normal, fertile and possess elevated levels of urate. (A) Expression of uox in 2 and 4 day post fertilization (dpf) WT and uox−/− larvae, as detected by WMISH (arrows mark the liver). Numbers in the lower right corner of each panel indicate the frequency of larvae showing the displayed expression pattern. (B) Expression of uox in WT (white bars) and uox−/− (grey bars) larvae at 4 dpf, as detected by qPCR using four independent exon-spanning primer pairs (Ex 1-2, Ex 2-3, Ex 5-6 and Ex 6-7, as shown in schematic). Data generated from three biological replicates, n = 10 larvae per group. Schematic shows the location of the four primer pairs in the uox gene. Statistical significance determined using multiple unpaired Student’s t-tests with Holm–Sidak correction. (C) Representative brightfield images of WT and uox−/− larvae at 2 dpf. (D) Kaplan–Meier survival curve of WT, uox+/− and uox−/− fish from 1 month to 18 months of age. Statistical significance determined using the log-rank (Mantel–Cox) test. (E) Representative brightfield images of age-matched female and male WT and uox−/− adult fish. (F) Quantification of urate (pmol urate/larvae) from dissociated 3, 4 and 5 dpf WT (white bars) and uox−/− (grey bars) larvae, as detected using a Roche C311 autoanalyzer. Data generated from three biological replicates, n = 40 larvae per group. Statistical significance determined using multiple unpaired Student’s t-tests. Error bars in (B,F) represent means ± SDs. Abbreviations: n.s. not significant, * p < 0.05, ** p < 0.01, *** p < 0.001 and **** p < 0.0001. Scale bars: 500 µm in (A,C), 2 mm in (E). |
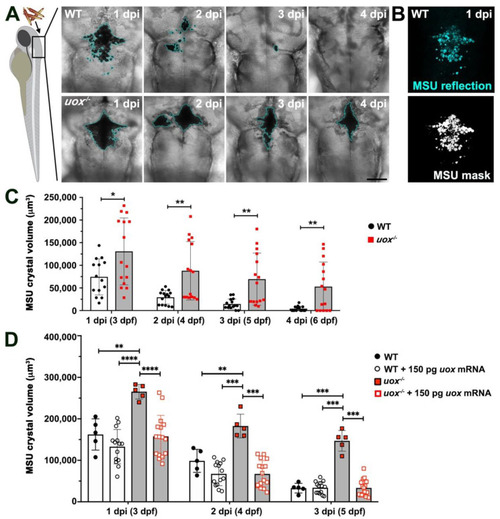
Microinjected MSU crystals persist in uox−/− larvae. (A) Representative confocal imaging (transmitted light views, Z-projections) of WT and uox−/− larvae at 1, 2, 3 and 4 days post-injection (dpi) with MSU crystals into the hindbrain ventricle (injected at 2 days post fertilization (dpf)). A cyan border outlines MSU crystals. (B) A representative reflection image of MSU crystals in a WT larva at 1 dpi (same larva as in (A)), pseudo-coloured in cyan. The lower panel shows a standard deviation Z–projection of the binary mask in black and white. (C) Quantification of MSU crystals (μm3), as detected in (B), within individual WT (white bars) and uox−/− (grey bars) larvae at 1, 2, 3 and 4 dpi (3, 4, 5 and 6 dpf, n = 15 larvae per group). Statistical significance determined using multiple unpaired Student’s t-tests with Holm–Sidak correction. (D) Quantification of MSU crystals (μm3) within individual WT (white bars) and uox−/− (grey bars) larvae at 1, 2 and 3 dpi (3, 4 and 5 dpf) and within WT (white bars) and uox−/− (grey bars) larvae injected with 150 pg uox mRNA (n= 5 and 15 larvae per group for the non-mRNA-injected and mRNA-injected groups, respectively). Statistical significance determined using a 2-way ANOVA and Tukey’s multiple comparisons test. Error bars in (C,D) represent means ± SDs. * p < 0.05, ** p < 0.01, *** p < 0.001 and **** p < 0.0001. Scale bar 100 µm. |
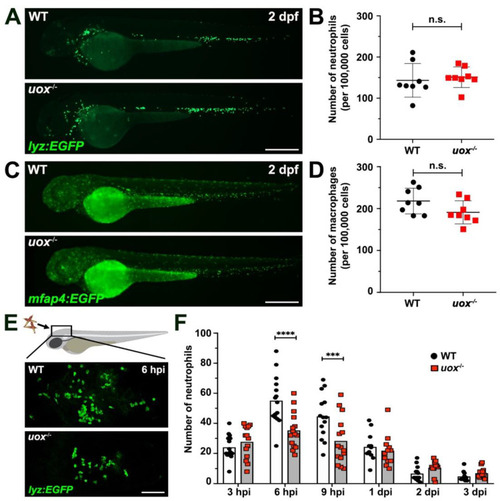
Uricase-deficient larvae demonstrate unaltered myelopoiesis and dampened neutrophil recruitment towards MSU crystal challenge. (A) Live imaging of neutrophils within 2 day post fertilization (dpf) WT and uox−/− Tg(lyz:EGFP) larvae. (B) Flow cytometry quantification of neutrophils within 2 dpf WT and uox−/− Tg(lyz:EGFP) larvae (n = 8 groups per genotype, 20 larvae per group). (C) Live imaging of macrophages within 2 dpf WT and uox−/− Tg(mfap4:EGFP) larvae. (D) Flow cytometry quantification of macrophages within 2 dpf WT and uox−/− Tg(mfap4:EGFP) larvae (n = 8 groups per genotype, 20 larvae per group). Statistical significance in (B,D) determined using unpaired two-tailed Student’s t tests. (E) Immunofluorescent detection of neutrophils within the hindbrain ventricle of WT and uox−/− Tg(lyz:EGFP) larvae, at 6 h post MSU crystal injection (hpi). (F) Quantification of neutrophil recruitment, as detected in (E), within WT (white bars) and uox−/− (grey bars) Tg(lyz:EGFP) larvae at 3, 6 and 9 hpi and 1, 2 and 3 days post MSU crystal injection (dpi), n = 12–15 larvae per treatment. Statistical significance determined using multiple unpaired Student’s t-tests with Holm–Sidak correction. Error bars in (B,D,F) represent means ± SDs. Abbreviations: n.s. not significant, *** p < 0.001 and **** p < 0.0001. Scale bars: 200 µm in (A,C,E). PHENOTYPE:
|
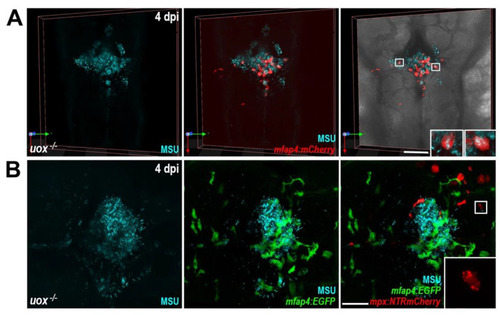
MSU crystal aggregates within uricase-deficient larvae are dominated by macrophages. (A) Live confocal imaging of MSU crystals within Tg(mfap4:mCherry);uox−/− larvae at 4 days post injection (dpi). Insets, magnified views of boxed regions showing MSU crystal-laden macrophages. (B) Live confocal imaging of MSU crystals within Tg(mfap4:EGFP);(mpx:NTRmCherry);uox−/− larvae at 4 dpi. Inset, magnified view of boxed region showing red fluorescent neutrophil debris. Scale bars: 100 µm in (A), 50 µm in (B). |