
- Title
-
Cytoplasmic pool of U1 spliceosome protein SNRNP70 shapes the axonal transcriptome and regulates motor connectivity
- Authors
- Nikolaou, N., Gordon, P.M., Hamid, F., Taylor, R., Lloyd-Jones, J., Makeyev, E.V., Houart, C.
- Source
- Full text @ Curr. Biol.
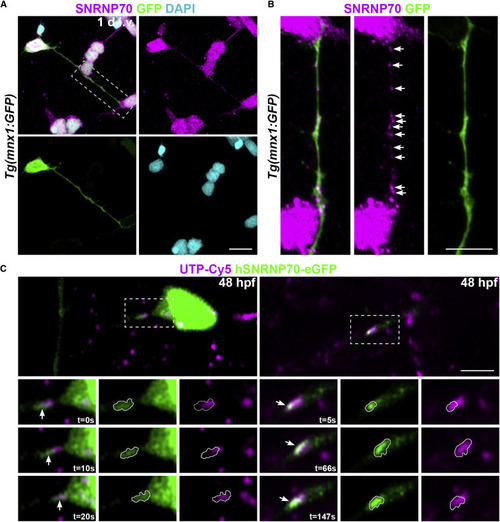
Figure 1. SNRNP70 localizes to axons (A) A representative image of a dissociated motor neuron at 1 day in vitro derived from Tg(mnx1:GFP) animals at 28 hpf. The sample was stained with anti-SNRNP70 to reveal the localization of the protein in neurites and DAPI to mark nuclei. Scale bars, 10 μm. (B) Inset showing a higher magnification of the motor axon in (A). Arrows indicate SNRNP70+ puncta within the GFP+ axon. Scale bars, 5 μm. (C) Time-lapse of neurons at 48 hpf sparsely labeled with hSNRNP70-eGFP. Top: images show GFP-labeled neurons co-expressing UTP-Cy5. Bottom: insets depict axon segments showing association between Cy5-RNA granules (magenta) and hSNRNP70-eGFP (green) signals (arrows indicate the same punctum during the imaging session with time shown in the bottom right corner of individual time points). In the single-channel images, the hSNRNP70-eGFP fluorescence signal has been outlined and overlayed in the UTP-Cy5 signal for a direct comparison. Representative examples from three independent experiments. Scale bars, 5 μm. See also Figure S1 and Video S1. |
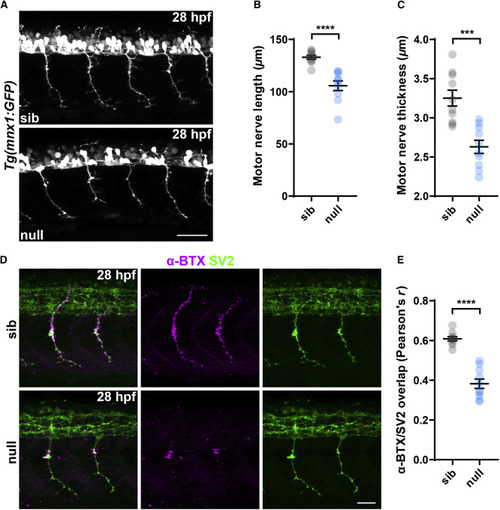
Figure 2. Loss of SNRNP70 affects motor neuron growth and neuromuscular connectivity (A) Representative maximum intensity projection images of Tg(mnx1:GFP) sibling and null trunk, lateral views with anterior to the left, at 28 hpf showing motor nerves innervating the myotome. Scale bars, 50 μm. (B and C) Quantifications showing the length and thickness of motor nerves in the two groups. All graphs show mean values ± SEM. ∗∗∗∗p < 0.0001; ∗∗∗p < 0.001, two-tailed unpaired t test, n = 10 animals per group in two independent experiments. (D) Maximum intensity projection images of sibling and null embryos at 28 hpf stained with anti-SV2 antibody to mark the pre-synaptic locations and a fluorescently tagged α-BTX to label AChRs on post-synaptic structures. Images are lateral views with anterior to the left. Scale bars, 25 μm. (E) Quantification of the degree of overlap between SV2 and α-BTX. The graph shows mean values ± SEM. ∗∗∗∗p < 0.0001, two-tailed unpaired t test, n = 10 animals per group in two independent experiments See also Figure S2. |
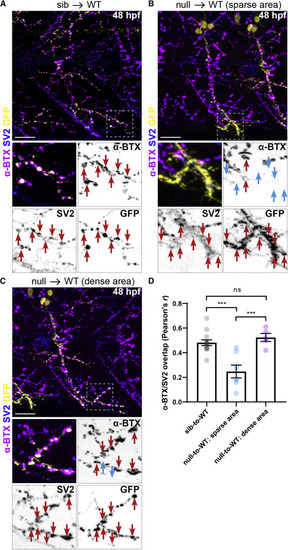
Figure 3. SNRNP70 is cell-autonomously required in motor neurons for neuromuscular assembly (A) A representative image showing transplanted sibling motor neurons derived from a Tg(mnx1:GFP) line innervating a WT host myotome that has been stained with anti-SV2 and α-BTX to mark pre- and post-synaptic sites, respectively. Bottom: inset depicting the apposition (red arrows) of pre- (within the GFP+ motor neurons) and post-synaptic sites within a small region of the myotome. Scale bars, 25 μm. (B and C) Examples of transplanted GFP+ null motor neurons innervating WT host myotomes that have been stained with anti-SV2 and α-BTX. In (B), null GFP+ motor axons terminate in a motor-axon-sparse region of the myotome, whereas in (C), they terminate in a motor-axon-dense region. Bottom: insets depicting the apposition (red arrows) of pre- (within the GFP+ motor neurons) and post-synaptic sites regions of the myotome. Cyan arrows indicate the absence of host AChR clusters adjacent to transplanted GFP+/SV2+ terminals. Scale bars, 25 μm. (D) Quantification of the degree of overlap between SV2 and α-BTX in the three groups of transplanted motor axons. The graph shows mean values ± SEM. ∗∗∗p< 0.001, one-way ANOVA, n = 6 donor/host pairs for sib-to-WT group, n = 3 donor/host pairs for null-to-WT group in three independent experiments. See also Figure S3. |
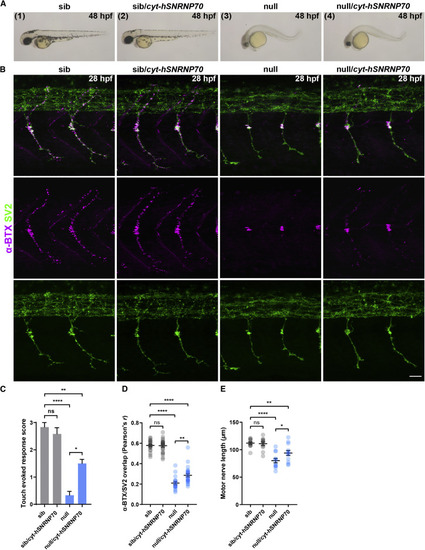
Figure 4. Ubiquitous overexpression of cytosolic hSNRNP70-eGFP partially restores motor neuron growth and neuromuscular assembly (A) Ubiquitous overexpression of cytosolic hSNRNP70-eGFP using the Tg(ubi:ERT2-Gal4;UAS:hSNRNP70ΔNLS3xNES-eGFP) line. Embryos derived from the same clutch were sorted into four groups according to genotype: (1) sib, (2) sib/cyt-hSNRNP70, (3) null, and (4) null/cyt-hSNRNP70. Representative images of live embryos at 48 hpf from three independent experiments. Images are lateral views with anterior to the left. (B) Maximum intensity projection images of trunk, lateral views with anterior to the left, at 28 hpf stained with anti-SV2 antibody to mark the pre-synaptic locations and a fluorescently tagged α-BTX to label AChRs on post-synaptic structures. Representative images from three independent experiments. Scale bars, 25 μm. (C) Quantification of touch-evoked startle response at 48 hpf. The graph shows mean values ± SEM. ∗∗∗∗p < 0.0001; ∗∗p < 0.01; ∗p < 0.05; ns, not significant, Kruskal-Wallis test, n = 12 animals per group in three independent experiments. (D) Quantification of the degree of overlap between SV2 and α-BTX at 28 hpf in the four groups. The graph shows mean values ± SEM. ∗∗∗∗p < 0.0001; ∗∗p < 0.01; ns, not significant, one-way ANOVA, n = 12 animals per group in three independent experiments. (E) Quantification of motor nerve length at 28 hpf. The graph shows mean values ± SEM. ∗∗∗∗p < 0.0001; ∗∗p < 0.01; ∗p < 0.05; ns, not significant, one-way ANOVA, n = 12 animals per group in three independent experiments. See also Figures S4 and S5. |
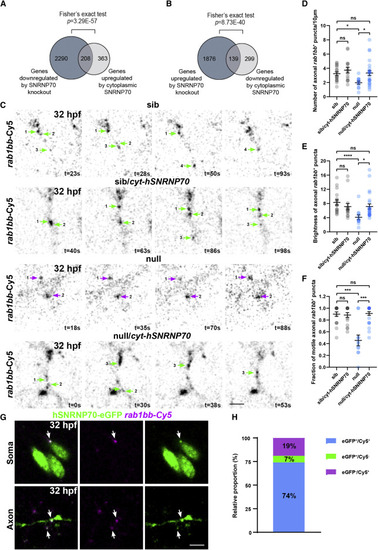
Figure 5. Cytoplasmic SNRNP70 regulates transcript abundance and motile behavior (A and B) Data are based on RNA-seq in 28 hpf embryos derived from the ubiquitous overexpression of cytosolic hSNRNP70-eGFP in sibling and null animals using the Tg(ubi:ERT2-Gal4;UAS:hSNRNP70ΔNLS3xNES-eGFP) line. Embryos were sorted into four groups according to genotype: (1) sib, (2) sib/cyt-hSNRNP70, (3) null, and (4) null/cyt-hSNRNP70. The Venn diagram in (A) shows the 2,498 genes downregulated after the loss of SNRNP70 (dark gray circle) and the 571 genes upregulated by cytoplasmic SNRNP70 (light gray circle). The intersection contains the 208 genes whose expression was significantly restored to control levels. The Venn diagram in (B) shows the 2,015 genes upregulated after the loss of SNRNP70 (dark gray circle) and the 438 genes downregulated by cytoplasmic SNRNP70 (light gray circle). The intersection contains the 139 genes whose expression was significantly restored to control levels. p values obptained following Fisher's exact test. (C) Time-lapse imaging of rab1bb-Cy5 labeled RNA puncta within sparse-labeled spinal cord neurons at 32 hpf. The images show an example from each one of the four experimental groups. Each numbered arrow indicates the same punctum during the imaging session, green arrows indicate motile axonal rab1bb+ puncta, and magenta arrows indicate stationary rab1bb+ puncta, with time shown in the bottom right corner of individual time points. Representative examples from two independent experiments. Scale bars, 5 μm. (D) Quantification of the density of rab1bb+ puncta in the four experimental groups. The graph shows mean values ± SEM. ∗p < 0.05; ns, not significant, Kruskal-Wallis test, n = 18 neurons from an average 6 animals per experimental group. (E) Quantification of the brightness of rab1bb+ puncta in the four experimental groups. The graph shows mean values ± SEM. ∗∗∗∗p < 0.0001; ∗p < 0.05; ns, not significant, Kruskal-Wallis test, n = 18 neurons from an average 6 animals per experimental group. (F) Quantification of the fraction of motile rab1bb+ puncta in the four experimental groups. The graph shows mean values ± SEM. ∗∗∗p < 0.001; ns, not significant, Kruskal-Wallis test, n = 18 neurons from an average 6 animals per experimental group. (G) Images depicting the co-localization (arrows) between hSNRNP70-eGFP protein (GFP+) and rab1bb RNA (Cy5+) within the soma and axons of labeled neurons at 32 hpf. Representative examples from two independent experiments. Scale bars, 5 μm. (H) Graph indicating the proportion of hSNRNP70-eGFP puncta (GFP+) colocalizing with rab1bb RNA (Cy5+). See also Figures S6 and S7, Table S1, and Videos S2 and S3. |
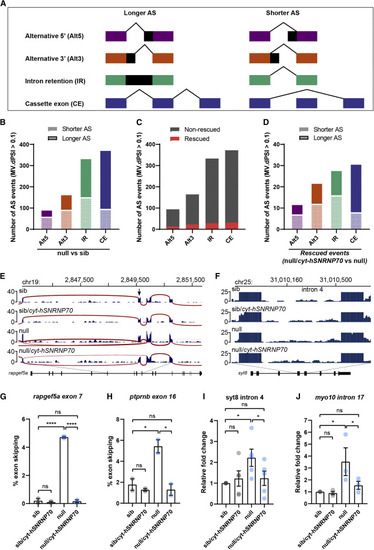
Figure 6. Cytoplasmic SNRNP70 modulates alternative splicing events Data are based on RNA-seq in 28 hpf embryos derived from ubiquitous overexpression of cytosolic hSNRNP70-eGFP in sibling and null animals using the Tg(ubi:ERT2-Gal4;UAS:hSNRNP70ΔNLS3xNES-eGFP) line. Embryos were sorted into four groups according to genotype: (1) sib, (2) sib/cyt-hSNRNP70, (3) null, and (4) null/cyt-hSNRNP70. (A) Key for alternative splicing changes shown in (B)–(D). (B) Graph showing the number of alternative splicing events that appear significantly different (MV.dPSI > 0.1) comparing null with sib embryos. n = 3 biological samples per genotype. (C) Quantification of the number of alternative splicing events that are significantly (MV.dPSI > 0.1) restored (shown in red) or not (gray) following the expression of cytosolic hSNRNP70-eGFP in null embryos. These data are based on a comparison between null versus sib and then between null/cyt-hSNRNP70 versus null. (D) Graph of the 93 rescued alternative splicing events from (C) depicting the effect loss of SNRNP70 had on these events prior to the rescue. These data are based on a comparison between null versus sib and then between null/cyt-hSNRNP70 versus null. (E and F) Sashimi plots illustrating the read distribution and splice junctions for a representative example of CE (rapgef5a exon7) (E) and IR (syt8 intron 4) (F) in the four experimental groups. The arrow in (E) indicates the skipped exon. (G and H) Semi-quantitative RT-PCR validation of rapfeg5a (G) and ptprnb (H) exon skipping events (rapgef5a exon 7 and ptprnb exon 16). The graphs show mean values ± SEM of the percentage of exon skipping in the four experimental groups. ∗∗∗∗p < 0.0001; ∗p < 0.05; ns, not significant, one-way ANOVA, datapoints represent two independent biological replicates per group. (I and J) RT-qPCR validation of syt8 (I) and myo10 (J) intron retention events (syt8 intron 4 and myo10 intron 17). The graphs show mean values ± SEM for fold change in expression in relation to control animals (sib) in the four experimental groups. ∗p < 0.05; ns, not significant, one-way ANOVA, datapoints represent multiple technical replicates from two independent biological replicates per group. See also Figure S6 and Tables S2 and S3. |
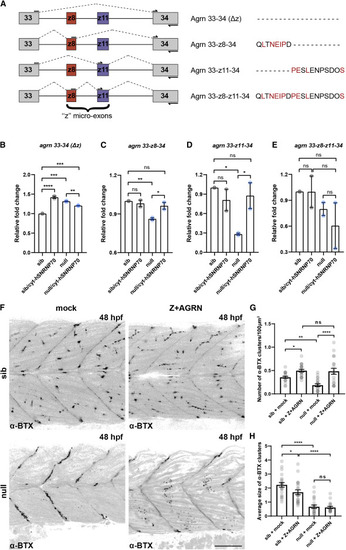
Figure 7. Cytoplasmic SNRNP70 regulates the abundance of Z+AGRN splice variants (A) Agrin Z+ (Z+AGRN) isoforms identified by RT-PCR are shown schematically, with conserved residues between humans and zebrafish shown in red. Arrows depict the position of primers used for the qPCR analysis in (B)–(E). (B–E) RT-qPCR analysis in sibling and null animals as well as following ubiquitous overexpression of cytosolic hSNRNP70-eGFP using Tg(ubi:ERT2-Gal4; UAS:hSNRNP70ΔNLS3xNES-eGFP) embryos at 28 hpf. Primers were designed to specifically amplify the expression of non-z+agrn (agrn 33–34 (Δz)) isoforms (B), as well as the three z+agrn isoforms: 33-z8-34 (C), 33-z11-34 (D), and 33-z8-z11-34 (E). The graphs show mean values ± SEM for fold change in expression in relation to control animals (sib). ∗∗∗∗p < 0.0001; ∗∗∗p < 0.001; ∗∗p < 0.01; ∗p < 0.05; ns, not significant, one-way ANOVA, datapoints represent two independent biological replicates per group. (F) Representative images depicting a superficial layer of the trunk myotomes showing the distribution of α-BTX-labeled AChR clusters in mock- and Z+AGRN-treated sibling and null animals at 48 hpf. Images are lateral views with anterior to the left. Scale bars, 50 μm. (G) Quantification of the number of α-BTX clusters in the four groups. The graph shows mean values ± SEM. ∗∗∗∗p < 0.0001; ∗∗p < 0.01; ∗p < 0.05; ns, not significant, one-way ANOVA, n = 21 animals per group in two independent experiments. (H) Graph showing mean values ± SEM of the average size of α-BTX clusters in the four groups. ∗∗∗∗p < 0.0001; ∗p < 0.05; ns, not significant, one-way ANOVA, n = 21 animals per group in two independent experiments. |