
Fig. 5
- ID
- ZDB-FIG-230509-25
- Publication
- Nikolaou et al., 2022 - Cytoplasmic pool of U1 spliceosome protein SNRNP70 shapes the axonal transcriptome and regulates motor connectivity
- Other Figures
- All Figure Page
- Back to All Figure Page
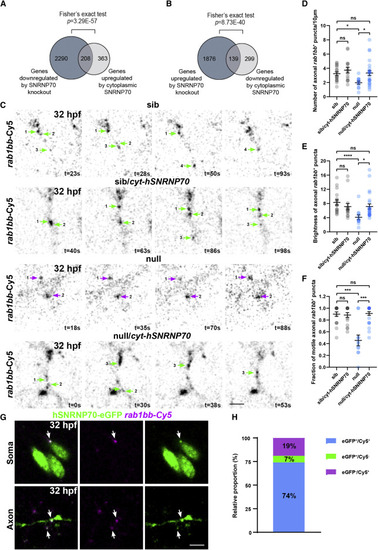
Figure 5. Cytoplasmic SNRNP70 regulates transcript abundance and motile behavior (A and B) Data are based on RNA-seq in 28 hpf embryos derived from the ubiquitous overexpression of cytosolic hSNRNP70-eGFP in sibling and null animals using the Tg(ubi:ERT2-Gal4;UAS:hSNRNP70ΔNLS3xNES-eGFP) line. Embryos were sorted into four groups according to genotype: (1) sib, (2) sib/cyt-hSNRNP70, (3) null, and (4) null/cyt-hSNRNP70. The Venn diagram in (A) shows the 2,498 genes downregulated after the loss of SNRNP70 (dark gray circle) and the 571 genes upregulated by cytoplasmic SNRNP70 (light gray circle). The intersection contains the 208 genes whose expression was significantly restored to control levels. The Venn diagram in (B) shows the 2,015 genes upregulated after the loss of SNRNP70 (dark gray circle) and the 438 genes downregulated by cytoplasmic SNRNP70 (light gray circle). The intersection contains the 139 genes whose expression was significantly restored to control levels. p values obptained following Fisher's exact test. (C) Time-lapse imaging of rab1bb-Cy5 labeled RNA puncta within sparse-labeled spinal cord neurons at 32 hpf. The images show an example from each one of the four experimental groups. Each numbered arrow indicates the same punctum during the imaging session, green arrows indicate motile axonal rab1bb+ puncta, and magenta arrows indicate stationary rab1bb+ puncta, with time shown in the bottom right corner of individual time points. Representative examples from two independent experiments. Scale bars, 5 μm. (D) Quantification of the density of rab1bb+ puncta in the four experimental groups. The graph shows mean values ± SEM. ∗p < 0.05; ns, not significant, Kruskal-Wallis test, n = 18 neurons from an average 6 animals per experimental group. (E) Quantification of the brightness of rab1bb+ puncta in the four experimental groups. The graph shows mean values ± SEM. ∗∗∗∗p < 0.0001; ∗p < 0.05; ns, not significant, Kruskal-Wallis test, n = 18 neurons from an average 6 animals per experimental group. (F) Quantification of the fraction of motile rab1bb+ puncta in the four experimental groups. The graph shows mean values ± SEM. ∗∗∗p < 0.001; ns, not significant, Kruskal-Wallis test, n = 18 neurons from an average 6 animals per experimental group. (G) Images depicting the co-localization (arrows) between hSNRNP70-eGFP protein (GFP+) and rab1bb RNA (Cy5+) within the soma and axons of labeled neurons at 32 hpf. Representative examples from two independent experiments. Scale bars, 5 μm. (H) Graph indicating the proportion of hSNRNP70-eGFP puncta (GFP+) colocalizing with rab1bb RNA (Cy5+). See also Figures S6 and S7, Table S1, and Videos S2 and S3. |