
|
Fig. 6
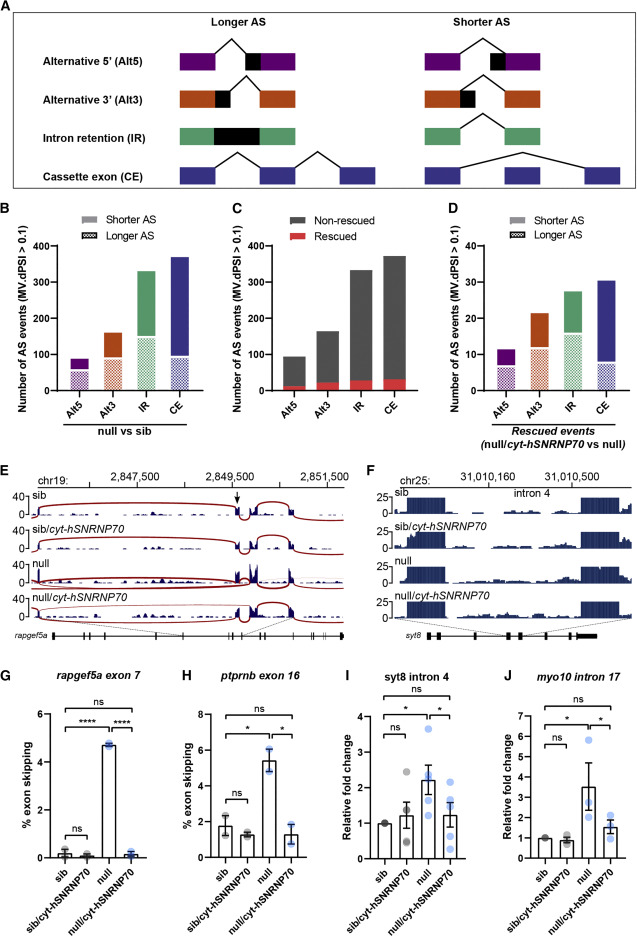
Figure 6. Cytoplasmic SNRNP70 modulates alternative splicing events Data are based on RNA-seq in 28 hpf embryos derived from ubiquitous overexpression of cytosolic hSNRNP70-eGFP in sibling and null animals using the Tg(ubi:ERT2-Gal4;UAS:hSNRNP70ΔNLS3xNES-eGFP) line. Embryos were sorted into four groups according to genotype: (1) sib, (2) sib/cyt-hSNRNP70, (3) null, and (4) null/cyt-hSNRNP70. (A) Key for alternative splicing changes shown in (B)–(D). (B) Graph showing the number of alternative splicing events that appear significantly different (MV.dPSI > 0.1) comparing null with sib embryos. n = 3 biological samples per genotype. (C) Quantification of the number of alternative splicing events that are significantly (MV.dPSI > 0.1) restored (shown in red) or not (gray) following the expression of cytosolic hSNRNP70-eGFP in null embryos. These data are based on a comparison between null versus sib and then between null/cyt-hSNRNP70 versus null. (D) Graph of the 93 rescued alternative splicing events from (C) depicting the effect loss of SNRNP70 had on these events prior to the rescue. These data are based on a comparison between null versus sib and then between null/cyt-hSNRNP70 versus null. (E and F) Sashimi plots illustrating the read distribution and splice junctions for a representative example of CE (rapgef5a exon7) (E) and IR (syt8 intron 4) (F) in the four experimental groups. The arrow in (E) indicates the skipped exon. (G and H) Semi-quantitative RT-PCR validation of rapfeg5a (G) and ptprnb (H) exon skipping events (rapgef5a exon 7 and ptprnb exon 16). The graphs show mean values ± SEM of the percentage of exon skipping in the four experimental groups. ∗∗∗∗p < 0.0001; ∗p < 0.05; ns, not significant, one-way ANOVA, datapoints represent two independent biological replicates per group. (I and J) RT-qPCR validation of syt8 (I) and myo10 (J) intron retention events (syt8 intron 4 and myo10 intron 17). The graphs show mean values ± SEM for fold change in expression in relation to control animals (sib) in the four experimental groups. ∗p < 0.05; ns, not significant, one-way ANOVA, datapoints represent multiple technical replicates from two independent biological replicates per group. See also Figure S6 and Tables S2 and S3.