FIGURE SUMMARY
Title

Leveraging Multiple Data Streams for Prioritization of Mixtures for Hazard Characterization

Authors
Rivera, B.N., Ghetu, C.C., Chang, Y., Truong, L., Tanguay, R.L., Anderson, K.A., Tilton, S.C.
Source
Full text @ Toxics

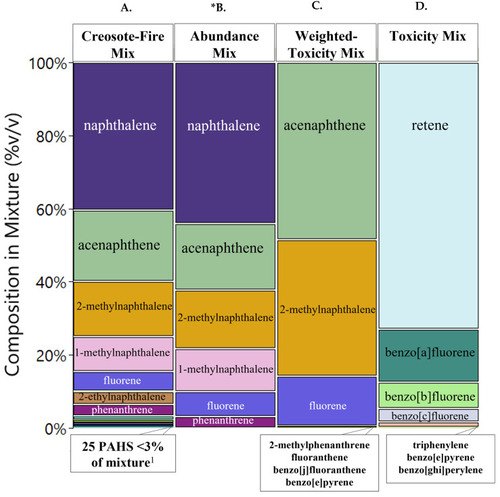
Chemical Composition of Mixtures. Chemicals greater than 3% v/v in the mixture are shown in colored sections. Colors and area of color correspond to a given chemical and the %v/v of that chemical in its respective mixture. Anything less than 3% v/v is listed below its respective mixture figure. (A). 30 chemicals identified above detection limits out of 63 PAHs air samples were analyzed for. (B). Chemicals prioritized strictly based on abundance, top seven PAHs that made up over 97% v/v in Creosote-Fire Mixture were selected. (C). Chemicals prioritized using empirically derived and predicted toxicity metrics. (D). Chemicals prioritized by weighting empirical and predicted toxicity metrics with chemical concentrations. 1 Full list of chemical composition in each mixture can be found in Tables S9 and S10. * 2-ethylnaphthalene was not included in Abundance Mix due to unavailability of the standard during synthesis of this mixture.

Comparison of Empirically Derived vs. QSAR Predicted Toxicity Values. Predicted RfD and RfC values were within the same magnitude as empirically derived values. IUR predictions were also within the same magnitude as empirical values. OSF had the largest difference between empirical and predicted values, which seemed to be associated with increasing molecular weight. *—empirically derived values. Reference Dose (RfD); Reference Concentration (RfC); Oral Slope Factor (OSF); Inhalation Unit Risk (IUR).

Correlations of Toxicity Metrics. (A) Correlation matrix of rankings for toxicity metrics used for Toxicity Mix. (B) Correlation matrix of toxicity metric rankings for Weighted-Toxicity Mix. Each square is labeled with correlation coefficient. Anything with an X was not significant. Significance cut-off was p < 0.05 using Pearson correlation coefficient. Correlations were conducted for each chemical only for complete observations.

Concentration-Response Curves for Mitochondrial Membrane Potential in NHBE. Curves are in order of decreasing potency based on predicted EC50 values. (A) Toxicity Mix was the most potent mixture with an EC50 of 50.5 µM. (B) Weighted-Toxicity Mix was the second most potent mixture with an EC50 of 572 µM. (C) Abundance Mix was the least potent mixture with EC50 of 1402 µM. (D) Creosote-Fire Mix did not elicit significant bioactivity compared to control, no EC50 was calculated. Concentrations significantly different from control are denoted with an asterisk (*). p < 0.05 *; p < 0.01 **; p < 0.001 ***.

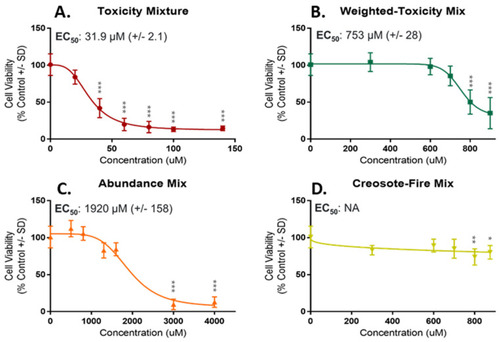
Concentration-Response Curves for Cell Viability in NHBE. Curves are in order from high to low potency based on predicted EC50 values. (A) Toxicity Mix was the most potent mixture with an EC50 of 31.9 µM. (B) Weighted-Toxicity Mix was the second most potent mixture with an EC50 of 753 µM. (C) Abundance Mix was the least potent mixture with EC50 of 1920 µM. (D) Creosote-Fire Mix had significant bioactivity for two highest doses, however, no EC50 was calculated. Concentrations significantly different from control are denoted with an asterisk (*). p < 0.05 *; p < 0.01 **; p < 0.001 ***.

Concentration-Response Curves for Mortality and Any Effect in Zebrafish. (A) Percent incidence of Zebrafish mortality and predicted LC50 and (B) Percent incidence of any effect and predicted EC50 value. Toxicity Mix was the only mixture with significant bioactivity in zebrafish. Any concentration at or above binomial significance threshold are denoted with an asterisk (*).

Acknowledgments
This image is the copyrighted work of the attributed author or publisher, and ZFIN has permission only to display this image to its users. Additional permissions should be obtained from the applicable author or publisher of the image. Full text @ Toxics