IMAGE

Figure 1

ID
ZDB-IMAGE-221211-197
Source
Figures for Rivera et al., 2022
Image
Figure Caption

Figure 1

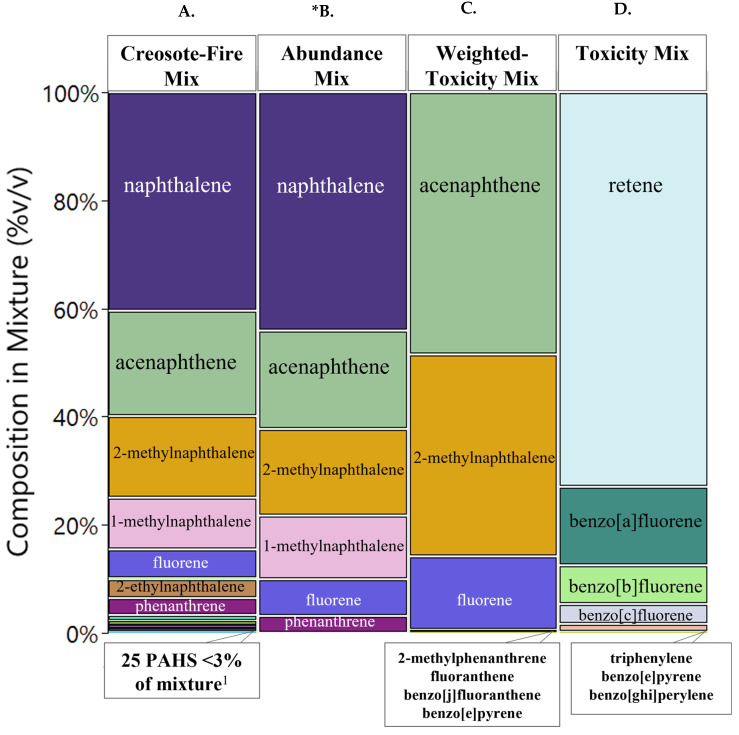
Chemical Composition of Mixtures. Chemicals greater than 3% v/v in the mixture are shown in colored sections. Colors and area of color correspond to a given chemical and the %v/v of that chemical in its respective mixture. Anything less than 3% v/v is listed below its respective mixture figure. (A). 30 chemicals identified above detection limits out of 63 PAHs air samples were analyzed for. (B). Chemicals prioritized strictly based on abundance, top seven PAHs that made up over 97% v/v in Creosote-Fire Mixture were selected. (C). Chemicals prioritized using empirically derived and predicted toxicity metrics. (D). Chemicals prioritized by weighting empirical and predicted toxicity metrics with chemical concentrations. 1 Full list of chemical composition in each mixture can be found in Tables S9 and S10. * 2-ethylnaphthalene was not included in Abundance Mix due to unavailability of the standard during synthesis of this mixture.

Acknowledgments
This image is the copyrighted work of the attributed author or publisher, and ZFIN has permission only to display this image to its users. Additional permissions should be obtained from the applicable author or publisher of the image. Full text @ Toxics