
Image
|
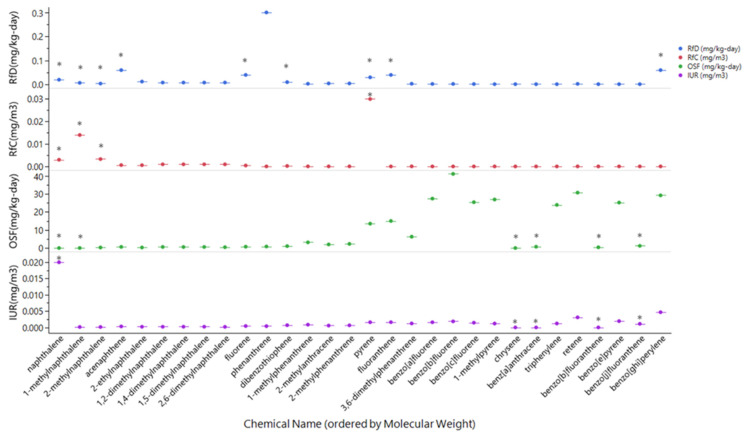
Figure Caption
Figure 2
Comparison of Empirically Derived vs. QSAR Predicted Toxicity Values. Predicted RfD and RfC values were within the same magnitude as empirically derived values. IUR predictions were also within the same magnitude as empirical values. OSF had the largest difference between empirical and predicted values, which seemed to be associated with increasing molecular weight. *—empirically derived values. Reference Dose (RfD); Reference Concentration (RfC); Oral Slope Factor (OSF); Inhalation Unit Risk (IUR).
Acknowledgments
This image is the copyrighted work of the attributed author or publisher, and
ZFIN has permission only to display this image to its users.
Additional permissions should be obtained from the applicable author or publisher of the image.
Full text @ Toxics