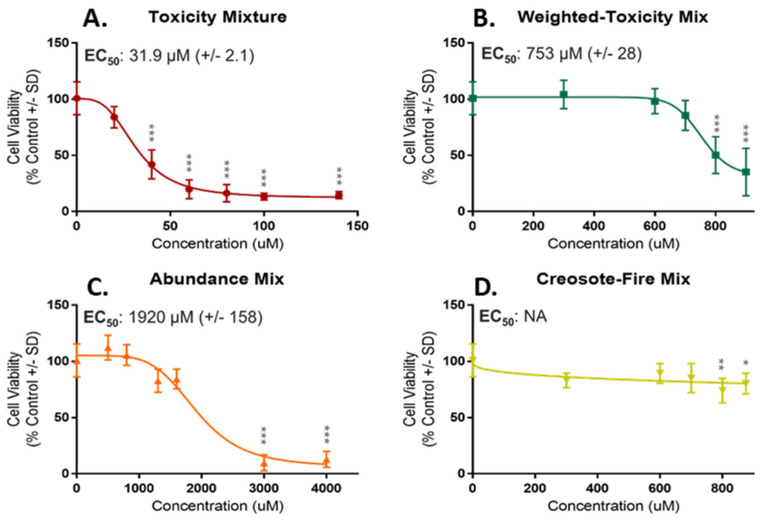
IMAGE

Figure 5

ID
ZDB-IMAGE-221211-183
Source
Figures for Rivera et al., 2022
Image
Figure Caption

Figure 5

Concentration-Response Curves for Cell Viability in NHBE. Curves are in order from high to low potency based on predicted EC50 values. (A) Toxicity Mix was the most potent mixture with an EC50 of 31.9 µM. (B) Weighted-Toxicity Mix was the second most potent mixture with an EC50 of 753 µM. (C) Abundance Mix was the least potent mixture with EC50 of 1920 µM. (D) Creosote-Fire Mix had significant bioactivity for two highest doses, however, no EC50 was calculated. Concentrations significantly different from control are denoted with an asterisk (*). p < 0.05 *; p < 0.01 **; p < 0.001 ***.

Acknowledgments
This image is the copyrighted work of the attributed author or publisher, and ZFIN has permission only to display this image to its users. Additional permissions should be obtained from the applicable author or publisher of the image. Full text @ Toxics