
- Title
-
A regulatory network of Sox and Six transcription factors initiate a cell fate transformation during hearing regeneration in adult zebrafish
- Authors
- Jimenez, E., Slevin, C.C., Song, W., Chen, Z., Frederickson, S.C., Gildea, D., Wu, W., Elkahloun, A.G., Ovcharenko, I., Burgess, S.M.
- Source
- Full text @ Cell Genom
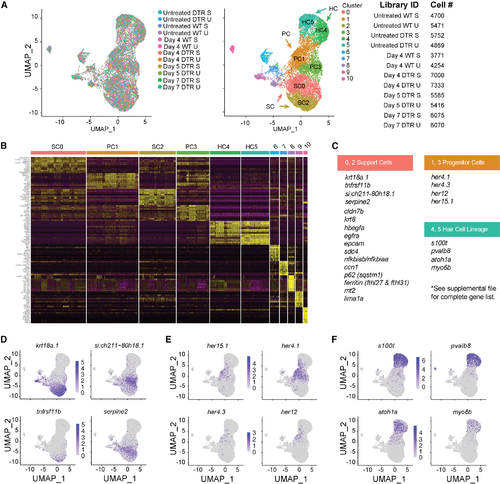
scRNA-seq of the auditory and vestibular epithelia identifies gene expression (A) Left: scRNA-seq UMAP of 15,443 single cells collected from 12 samples. Each dot represents a single cell and colors distinguish samples. Middle: cells were clustered and labeled based on known cell markers. A single, joint clustering detects 11 cell populations. Clusters 0 to 5 consist of cells that contribute to the sensory epithelium: support cells (SCs) are clusters 0 (SC0) and 2 (SC2); progenitor cells (PCs) are clusters 1 (PC1) and 3 (PC3); and hair cells (HC) are clusters 4 (HC4) and 5 (HC5). Right: identifiers and cell counts for samples collected for scRNA-seq. S, saccule; U, utricle; DTR, heterozygous Tg(myo6b:hDTR) transgenic zebrafish; Day, number of days after DT injection, for a total of 66,293 sampled cells. (B) Heatmap showing the relative expression levels of the top 10 differentially expressed genes (y axis) from each cluster (x axis). The cell population identity assigned to each cluster is indicated above each column and colors correspond to clusters in (B). (C) Table of top significant marker genes. (D–F) (D) UMAP plots of marker genes overrepresented in SCs, (E) PCs, and (F) HCs. |
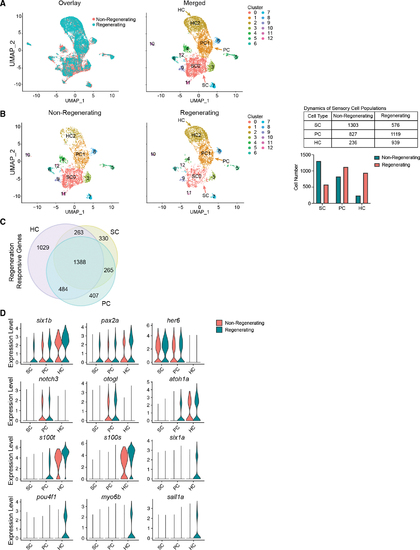
Cell-type-specific gene expression and expansion of HC lineage populations during regeneration (A) Left: UMAP showing overlay of inner ear cells between non-regenerating and regenerating sensory epithelia. Colors distinguish conditions. Right: UMAP of cells across conditions grouped together based on gene expression, detecting 13 cell populations. Cluster 0 consists of SCs (SC0). Cluster 1 consists of PCs (PC1). Cluster 2 consists of HCs (HC2). (B) Left: UMAP plots of non-regenerating and regenerating conditions side-by-side. The colors distinguish clusters labeled in (A). Middle: UMAP of 3,670 randomly sampled single cells from non-regenerating controls (pooled wild-type, untreated Tg(myo6b:hDTR), and wild-type fish injected with DT). UMAP of 3,330 randomly sampled single cells from regenerating samples on days 4, 5, and 7 post injection. Samples include saccules and utricles. Right: table and bar graph of cell numbers in non-regenerating and regenerating SCs, PCs, and HCs. (C) Venn diagram showing overlapping and unique differentially expressed genes in HCs, SCs, and PCs. (D) Violin plots showing the distribution of gene expression of top genes identified with differential expression testing across cell types (p < 0.01; FC ≥ 0.25). |
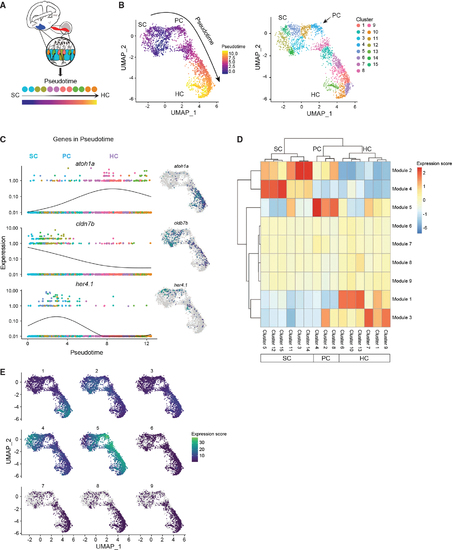
Cell lineages in the inner ear (A) Schematic illustrating pseudotime cell ordering in the adult zebrafish inner ear. Inner ear HC lineage populations are colored according to their cluster membership and shown in pseudotime order. (B) Left: cells progressing through the HC regeneration program. The arrow indicates the trajectory of the pseudotime differentiation gradient from purple to yellow. SCs are the root node of the trajectory graph, PCs emerge after HC injury and are a clear intermediate to both SCs and HCs. Right: UMAP showing the separation of HC lineage populations into groups after re-clustering for pseudotime (resolution = 1 × e−2 for Louvain clustering). Subclusters 3, 5, 11, 12, 14, and 15 belong to SCs. Subclusters 2, 4, and 8 belong to PCs. Subclusters 1, 6, 7, 9, 10, and 13 belong to HCs. The arrow indicates the first PC cluster (cluster 4) that is transcriptionally distinct from SCs. (C) Gene expression dynamics of select genes as a function of pseudotime for SCs, PCs, and HCs. Colors distinguish subclusters belonging to SC, PC, and HC populations. Adjacent UMAP plots of select genes that are differentially expressed through the trajectory. (D) Clustered heatmap of gene modules co-regulated along the pseudotime during HC initiation, progression, and maturation. Nine modules and their expression intensity in each cluster are shown. Clusters correspond to cell populations as indicated on the horizontal axis. (E) Maps showing modules expressed in specific clusters, while other modules are shared across multiple states of pseudotime. |
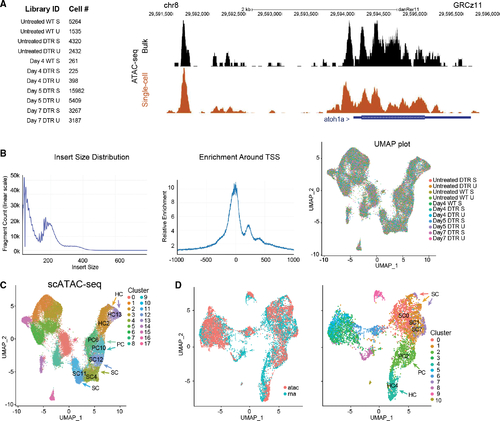
scATAC-seq of auditory and vestibular epithelia during regeneration (A) Left: identifiers and cell counts for samples collected for scATAC-seq. S, saccule; U, utricle; DTR, heterozygous Tg(myo6b:hDTR) transgenic zebrafish; and Day, number of days after DT injection (total = 42,278 cells). Right: genome browser track of the atoh1a locus highlighting annotated peaks comparing single-cell data with bulk ATAC-seq. (B) Left: the library fragment size distribution displayed nucleosome banding patterns. Middle: sequencing reads showed strong enrichment around transcriptional start sites (TSS). Right: high sample agreement is shown between all samples. (C) Aggregate of all scATAC-seq samples, including untreated samples. Clusters 4, 11, and 12 consist of SC: SC4, SC11, and SC12. Clusters 6 and 10 consist of PCs: PC6 and PC10. Clusters 2 and 13 consist of HCs: HC2 and HC13. (D) Left: UMAP co-embedding shows scATAC-seq and scRNA-seq cells on the same plot. Right: RNA cluster groups maintain cohesion in ATAC-seq data. SC populations are clusters 0, 1, and 7: SC0, SC1, and SC7. PC cell population is cluster 2: PC2. HC population is cluster 4: HC4. |
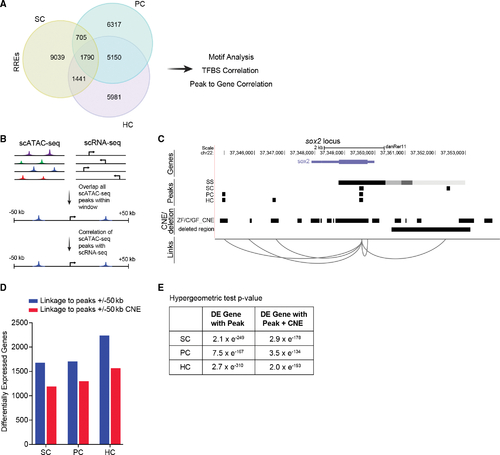
Correlation of scATAC-seq peaks to conserved regions and to differentially expressed genes (A) Venn diagram of regeneration-responsive elements (RREs) identified in SCs, PCs, and HCs. (B) Schematic of the approach used to link scATAC-seq peaks in proximal and distal DNA elements to genes. (C) Schematic of predicted links between peaks near the gene, sox2. For each cell type, a track is shown, including peaks present in non-regenerating controls (SS, steady state), conserved non-coding elements (CNEs) from genomic four-way phastcons (Z, zebrafish; C, grass and common carp; GF, goldfish), and the deleted region in sox2hg138 mutants. Genome coordinates of peaks, CNEs, and deleted region are represented by black bars. (D) Bar graphs showing the number of RREs that are within 50 kb of differentially expressed genes (blue) and overlap with CNEs (red) in each cell type. (E) Intersections of differentially expressed (DE) genes with peaks and peaks with CNEs are statistically significant (p < 0.001). |
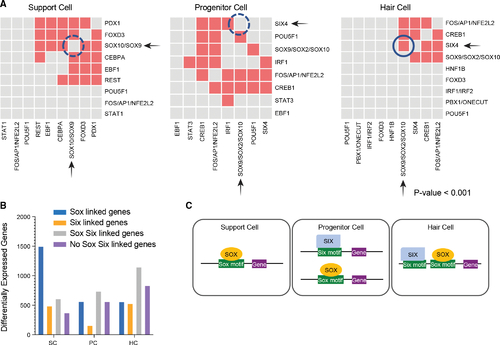
Combinatorial accessibility of Six and Sox TFs are defined by distinct cell identities (A) Pairwise predicted TF co-association in SCs, PCs, and HCs. x and y axes show significantly enriched predicted TF binding sites. Gray boxes represent lack of co-association between the TFs, whereas the colored boxes represent co-association. Correlation of TFBSs p < 0.001. (B) Sox and/or Six TF motif containing enhancers associated with differentially expressed genes in SCs, PCs, or HCs. Categories of TF containing motifs include Sox containing, Six containing, Sox and Six containing, or neither. (C) Model of Six and Sox TFs with cooperative roles functioning as either stem cell promoting or HC promoting factors. |
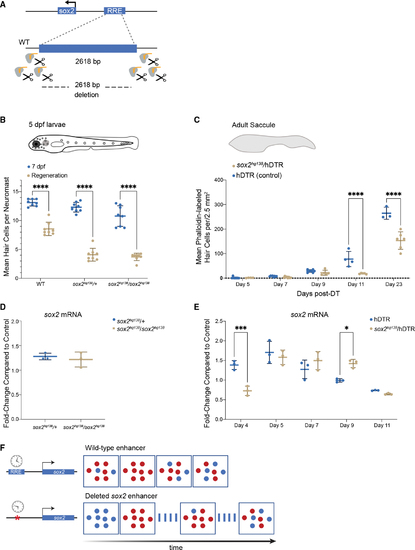
The −1,995 bp sox2 enhancer element is required for HC regeneration (A) Generation of enhancer deletion mutants using CRISPR-Cas9 editing. (B) Lateral line HC regeneration is strongly inhibited 2 days after CuSO4 ablation in homozygous (soxhg138/soxhg138) and heterozygous (soxhg138/+) enhancer deletion mutants. The average number of HCs and SD are shown in the graph. A two-way ANOVA comparison and Sidak multiple comparison test of the data obtained on untreated larvae with the data obtained from CuSO4 treated larvae ∗∗∗∗p < 0.0001. Error bars show SD. n = 8 larvae in each group. (C) Adult HC regeneration is significantly inhibited up to 23 days after HC ablation in heterozygous (soxhg138/hDTR) enhancer deletion mutants. The average number of HCs is shown in the graph. A two-way ANOVA comparison of the data obtained on regenerating control Tg(myo6b:hDTR) saccule (hDTR, blue) with the data obtained from regenerating heterozygous enhancer deletion mutant (soxhg138/hDTR, beige) saccule and Sidak multiple comparison test: ∗∗∗∗p < 0001. Error bars show SD. n = 6–8 saccules in each group unless otherwise indicated. (D) Quantitative real-time PCR measuring sox2 mRNA levels in adult homeostatic sensory epithelia (saccule) from heterozygous (sox2hg138/+, blue) and homozygous (sox2hg138/sox2hg138, beige) enhancer deletion mutants. Fold-change compared with homeostatic sensory epithelia (saccule) of wild-type controls of the same age. (E) Quantitative real-time PCR measuring sox2 mRNA levels in regenerating sensory epithelia (saccule) from Tg(myo6b:hDTR) controls (hDTR, blue) and sensory epithelia from heterozygous enhancer deletion mutants (sox2hg138/hDTR, beige) shows that activation of sox2 expression is delayed by 24 h (day 4) then remains elevated for an additional 24 h (day 9). The delay in sox2 expression at day 4 and the persistent expression at day 9 are statistically significant. A two-way ANOVA comparison of the data obtained on regenerating control (hDTR, blue) saccule with the data obtained from regenerating heterozygous enhancer deletion mutant saccule (soxhg138/hDTR, beige) and Sidak multiple comparison test: ∗p < 0.02, ∗∗∗p < 0.0004. Error bars show SD and triplicate technical replicates from dissected saccule of six to eight adult fish are shown in the graph. (F) The upstream enhancer is involved in regulating the timing of sox2 expression but not essential for triggering activation. sox2 gene activation occurring in the supporting cells is depicted by the appearance of red dots. sox2 levels are delayed in enhancer deletion mutants compared with wild-type, but reaches the appropriate levels 24 h later. The return to baseline expression is also delayed by 24 h. |