
|
Figure 4.
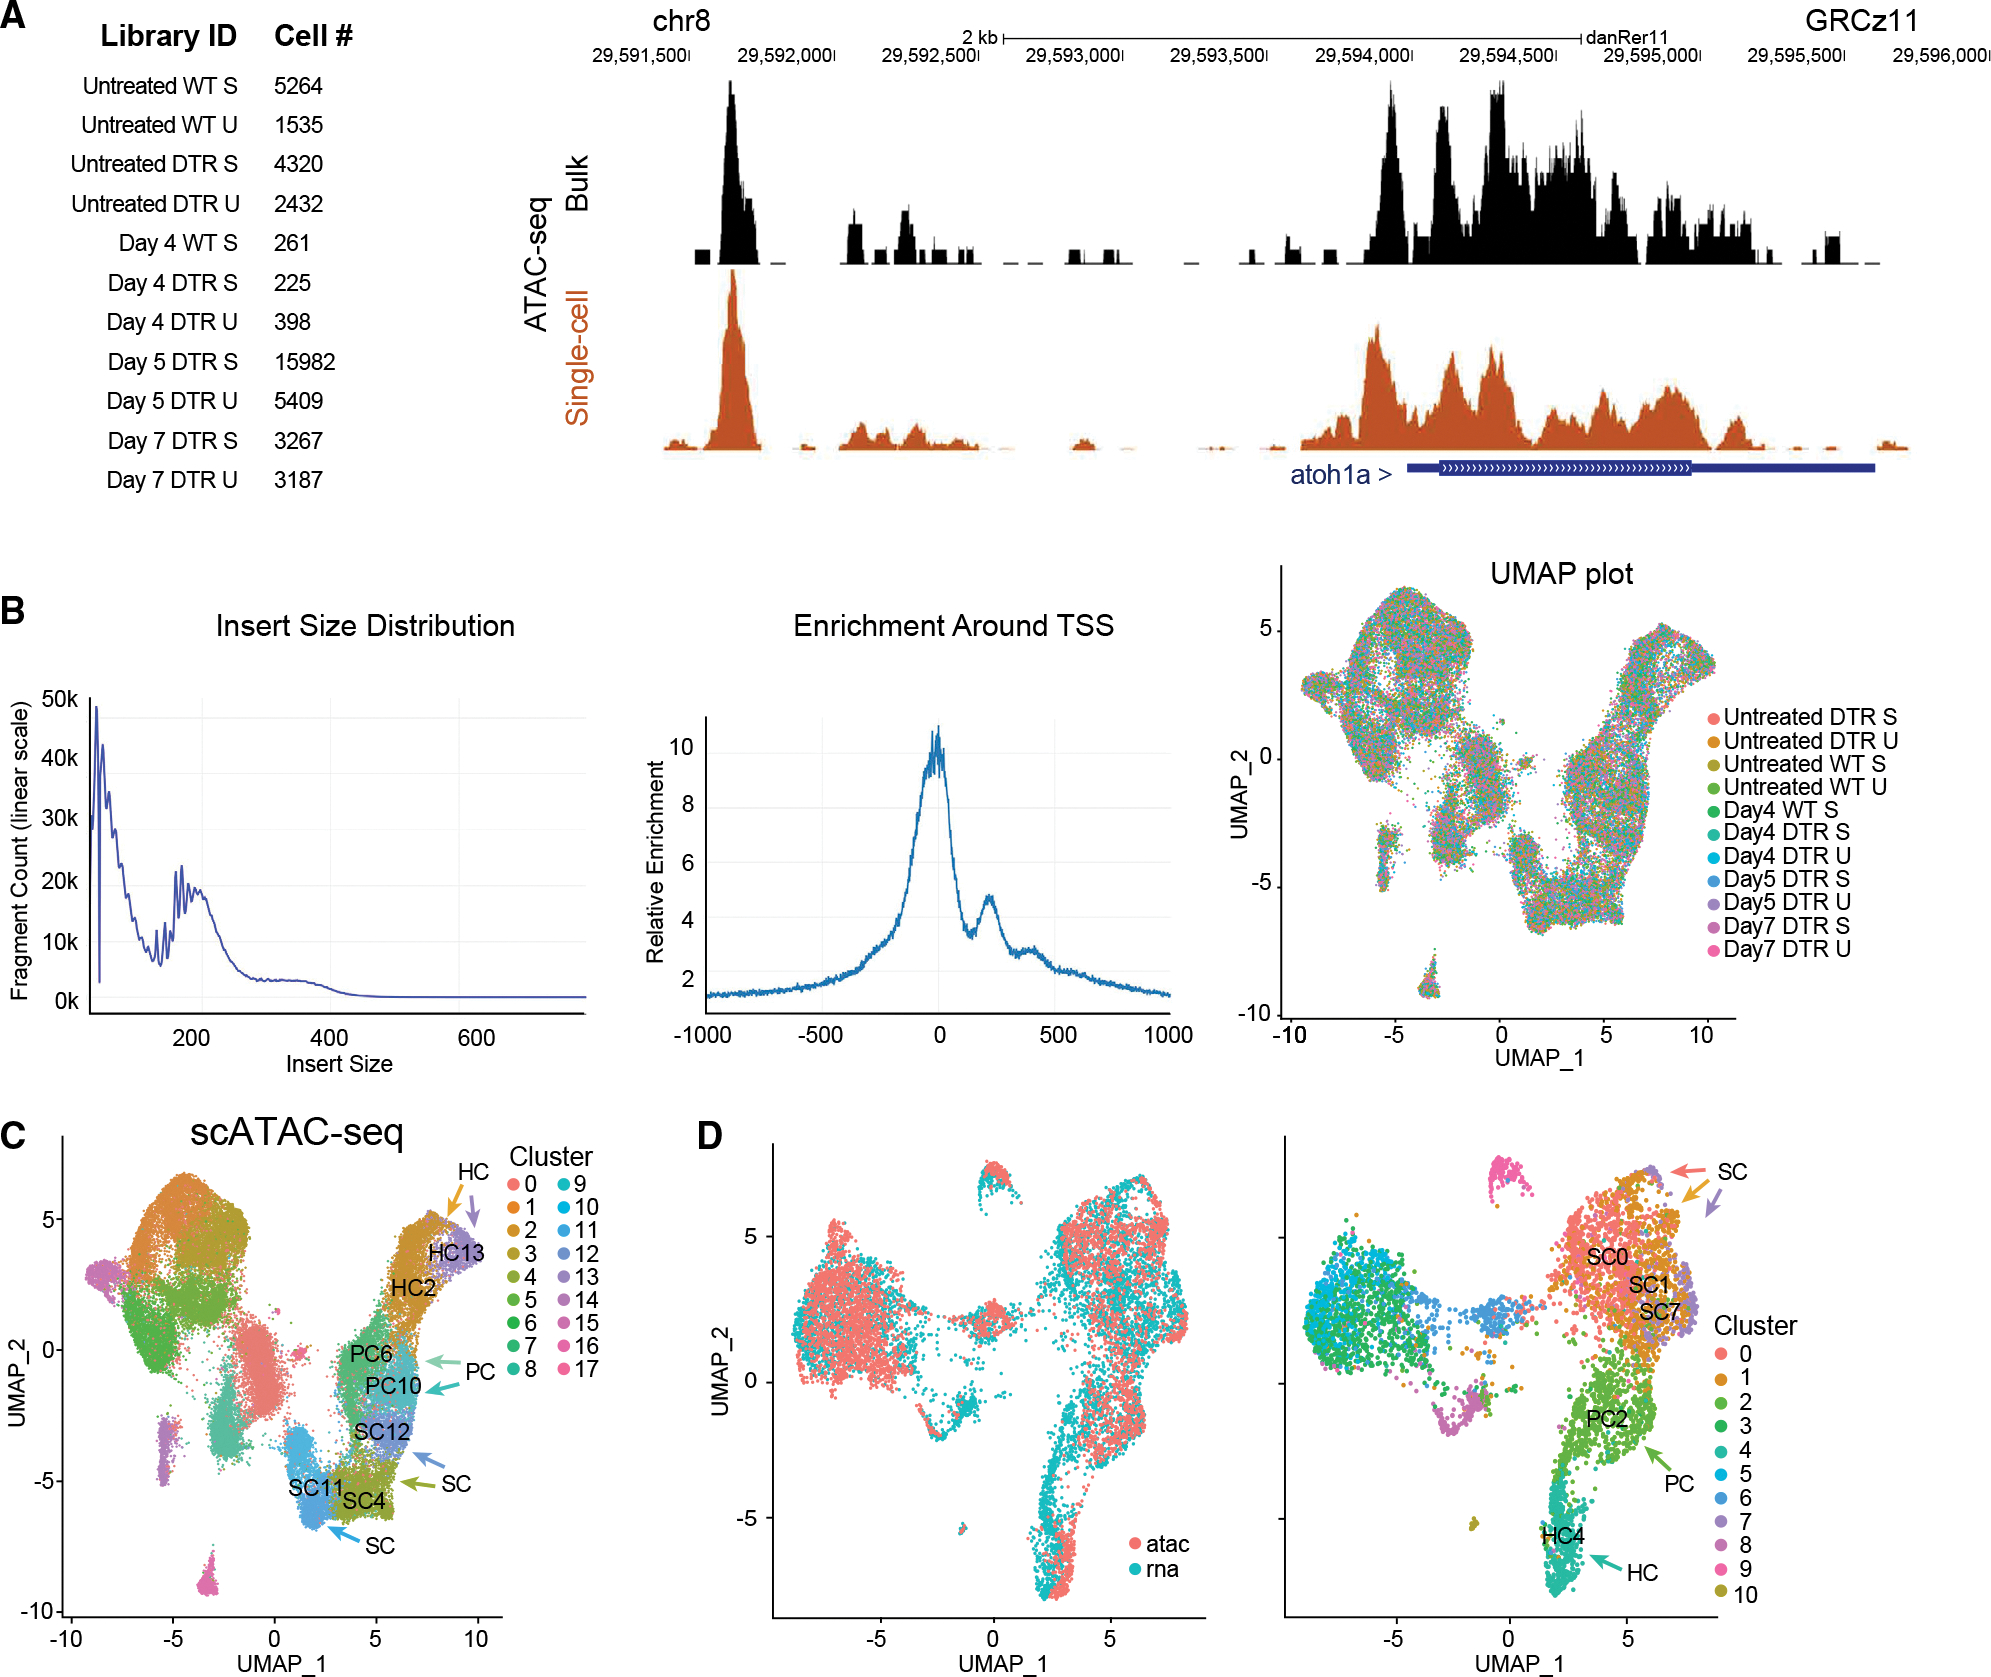
scATAC-seq of auditory and vestibular epithelia during regeneration
(A) Left: identifiers and cell counts for samples collected for scATAC-seq. S, saccule; U, utricle; DTR, heterozygous Tg(myo6b:hDTR) transgenic zebrafish; and Day, number of days after DT injection (total = 42,278 cells). Right: genome browser track of the atoh1a locus highlighting annotated peaks comparing single-cell data with bulk ATAC-seq.
(B) Left: the library fragment size distribution displayed nucleosome banding patterns. Middle: sequencing reads showed strong enrichment around transcriptional start sites (TSS). Right: high sample agreement is shown between all samples.
(C) Aggregate of all scATAC-seq samples, including untreated samples. Clusters 4, 11, and 12 consist of SC: SC4, SC11, and SC12. Clusters 6 and 10 consist of PCs: PC6 and PC10. Clusters 2 and 13 consist of HCs: HC2 and HC13.
(D) Left: UMAP co-embedding shows scATAC-seq and scRNA-seq cells on the same plot. Right: RNA cluster groups maintain cohesion in ATAC-seq data. SC populations are clusters 0, 1, and 7: SC0, SC1, and SC7. PC cell population is cluster 2: PC2. HC population is cluster 4: HC4.