
|
Figure 3.
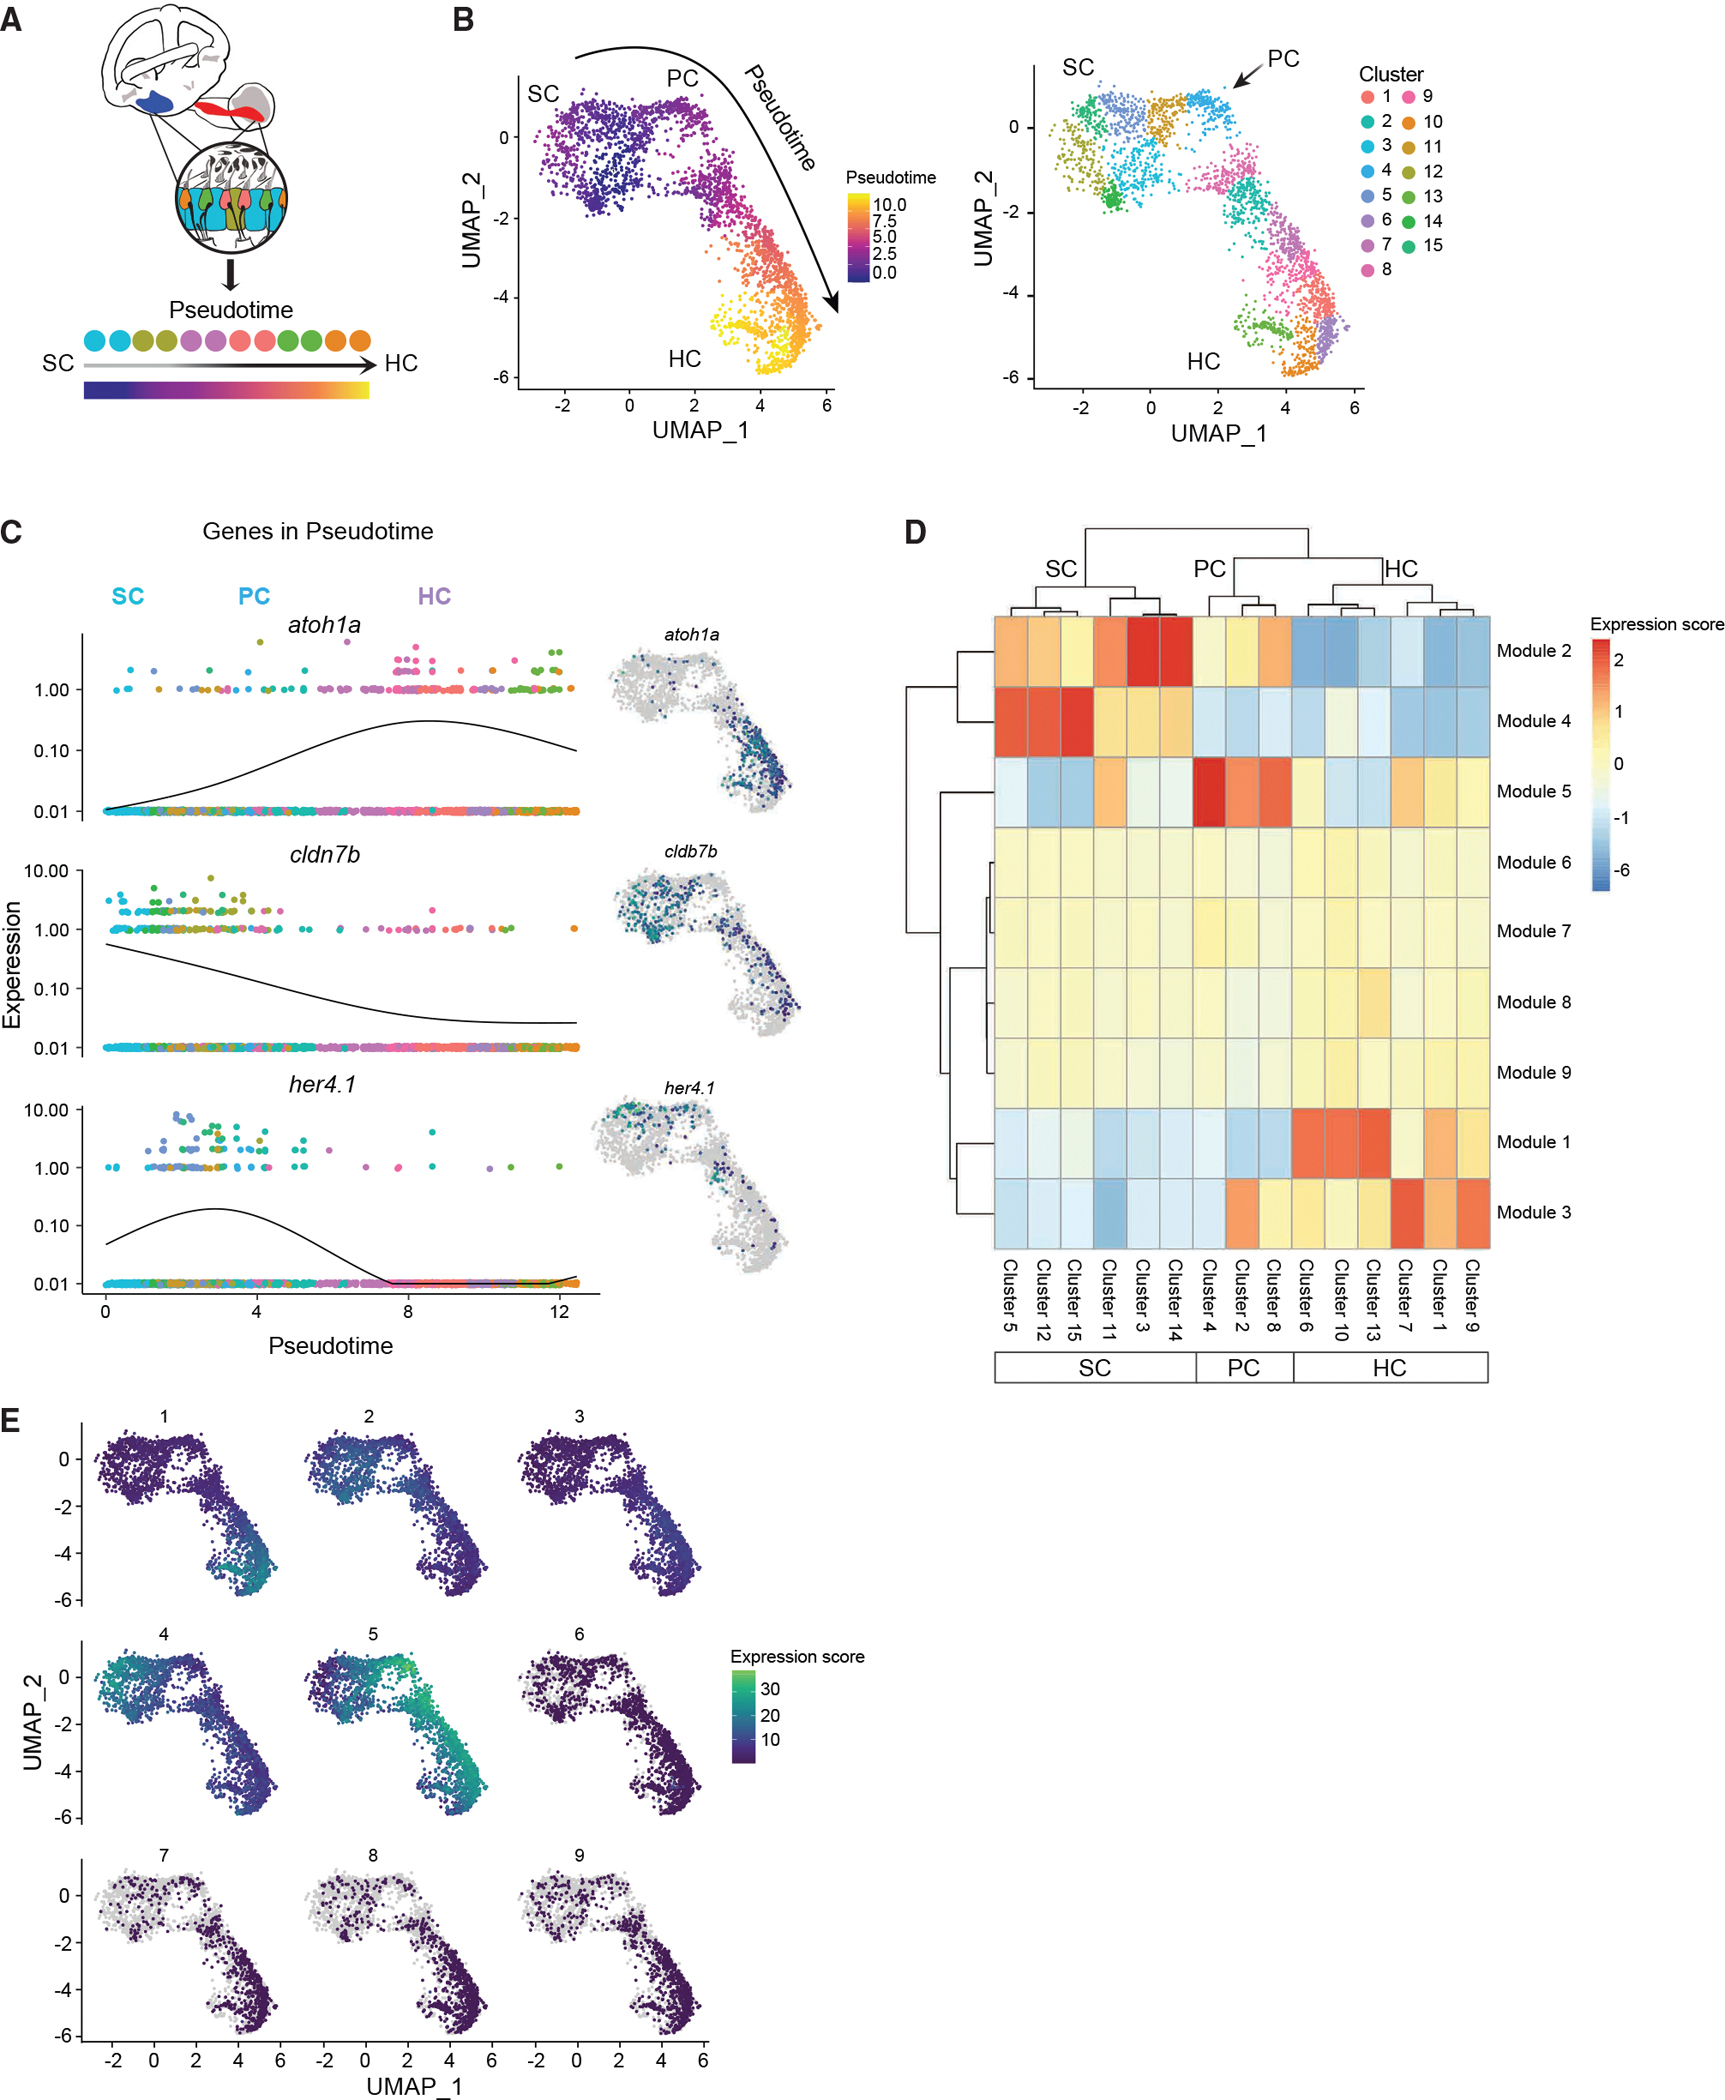
Cell lineages in the inner ear
(A) Schematic illustrating pseudotime cell ordering in the adult zebrafish inner ear. Inner ear HC lineage populations are colored according to their cluster membership and shown in pseudotime order.
(B) Left: cells progressing through the HC regeneration program. The arrow indicates the trajectory of the pseudotime differentiation gradient from purple to yellow. SCs are the root node of the trajectory graph, PCs emerge after HC injury and are a clear intermediate to both SCs and HCs. Right: UMAP showing the separation of HC lineage populations into groups after re-clustering for pseudotime (resolution = 1 × e−2 for Louvain clustering). Subclusters 3, 5, 11, 12, 14, and 15 belong to SCs. Subclusters 2, 4, and 8 belong to PCs. Subclusters 1, 6, 7, 9, 10, and 13 belong to HCs. The arrow indicates the first PC cluster (cluster 4) that is transcriptionally distinct from SCs.
(C) Gene expression dynamics of select genes as a function of pseudotime for SCs, PCs, and HCs. Colors distinguish subclusters belonging to SC, PC, and HC populations. Adjacent UMAP plots of select genes that are differentially expressed through the trajectory.
(D) Clustered heatmap of gene modules co-regulated along the pseudotime during HC initiation, progression, and maturation. Nine modules and their expression intensity in each cluster are shown. Clusters correspond to cell populations as indicated on the horizontal axis.
(E) Maps showing modules expressed in specific clusters, while other modules are shared across multiple states of pseudotime.