
- Title
-
The developing epicardium regulates cardiac chamber morphogenesis by promoting cardiomyocyte growth
- Authors
- Boezio, G.L.M., Zhao, S., Gollin, J., Priya, R., Mansingh, S., Guenther, S., Fukuda, N., Gunawan, F., Stainier, D.Y.R.
- Source
- Full text @ Dis. Model. Mech.
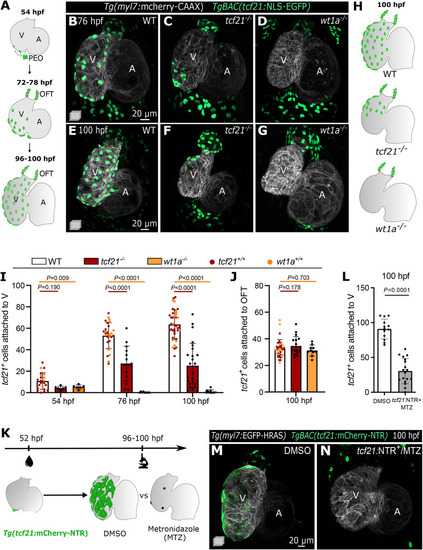
The transcription factors Tcf21 and Wt1a are required for epicardial attachment to the ventricle. (A) Schematic representation of the epicardial coverage of the zebrafish embryonic and larval heart. (B-G) Confocal images of 76 hpf (B-D) and 100 hpf (E-G) Tg(myl7:mCherry-CAAX) TgBAC(tcf21:NLS-EGFP) larvae. (H) Schematics of the epicardial coverage in 100 hpf WT, tcf21−/− and wt1a−/− larvae. Gray, myocardium; green, EpiCs. (I-J) Quantification of tcf21+ EpiCs attached to the ventricular myocardium (I) and OFT (J). The colors of WT dots refer to tcf21+/+ (red) and wt1a+/+ (orange) siblings. Data show the mean±s.d. P-values were determined from unpaired two-tailed t-test or Mann–Whitney test (following normality test) compared with +/+ siblings of each genotype. (K) Epicardial ablation protocol using the NTR/MTZ system. (L) Quantification of tcf21+ EpiCs attached to the ventricular myocardium following epicardial ablation. Data show the mean±s.d.; P-values were determined from unpaired two-tailed t-test. Controls are pooled tcf21:NTR+ DMSO-treated and tcf21:NTR− MTZ-treated larvae (see Materials and Methods). (M,N) Confocal images of 100 hpf Tg(myl7:EGFP-HRAS); TgBAC(tcf21:mCherry-NTR) hearts showing the absence of EpiCs post MTZ treatment (N), compared with DMSO-treated larvae (M). WT, wild type; A, atrium; V, ventricle; OFT, outflow tract; PEO, proepicardial organ. |
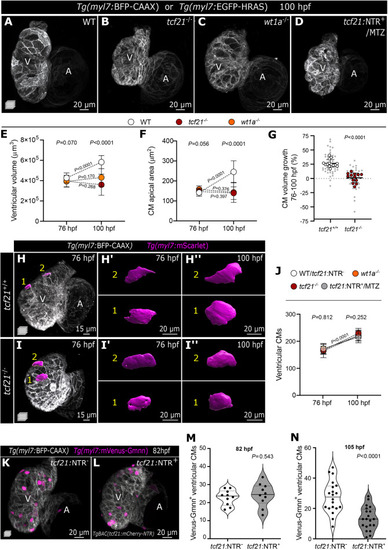
Impaired epicardial coverage affects ventricular cardiomyocyte size increase and ventricular growth. (A-D) Confocal images of 100 hpf WT, tcf21−/−, wt1a−/− and TgBAC(tcf21:mCherry-NTR)+ (tcf21:NTR+) MTZ-treated larvae, exhibiting reduced ventricular size. (E,F) Change in ventricular volume (E) and CM apical area (F) from 76 to 100 hpf in WT, tcf21−/− and wt1a−/− larvae. (G) Percentage increase of individual CM volume between 76 and 100 hpf, measured by the myl7:mScarlet signal. Large dots indicate the average per larva and small dots indicate individual CMs. P-values were determined from unpaired two-tailed t-test comparing the averages per larva. (H-I″) Confocal images of Tg(myl7:BFP-CAAX); tcf21+/+ or tcf21−/− larva at 76 and 100 hpf (same larvae shown), injected with myl7:mScarlet DNA to label individual CMs. (H′-I″) 3D surface rendering of individual CMs at the two time points. (J) Changes in ventricular CM numbers from 76 to 100 hpf in WT (or tcf21:NTR−), tcf21−/−, wt1a−/− and tcf21:NTR+-MTZ treated larvae. (K-N) Confocal images and quantification of myl7:mVenus-Gmnn+ CMs in 82 hpf (K-M) and 105 hpf (N) control (tcf21:NTR−) and tcf21:NTR+ MTZ-treated larvae. P-values (M,N) were determined by unpaired two-tailed t-test. Data show the mean±s.d. (E,F,G,J), and the solid and dotted lines (M,N) indicate the median and quartiles, respectively. P-values from one-way ANOVA among the three different genotypes at the same time point are shown above the graph (E,F,J), or from unpaired two-tailed t-test comparing the two different time points within the same genotype are shown on the dotted lines (E,F,J). Single data points are shown in Fig. S2. WT, wild type; A, atrium; V, ventricle. PHENOTYPE:
|
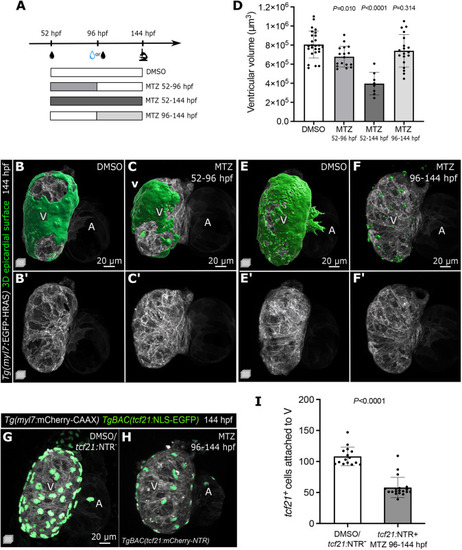
Epicardial cells are required for ventricular cardiomyocyte growth during early cardiac morphogenesis, but are dispensable at later time points. (A) Schematic of the MTZ treatment protocol. (B-C′,E-F′) Confocal images of 144 hpf Tg(myl7: EGFP-HRAS); TgBAC(tcf21:mCherry-NTR) DMSO and MTZ-treated larvae. Green, 3D reconstruction of epicardial coverage showing a partial recovery of EpiCs in 52-96 hpf MTZ-treated larvae, and a clear reduction in 96-144 hpf MTZ-treated larvae. (D) Quantification of ventricular volume at 144 hpf following epicardial regeneration or late epicardial ablation. (G-I) Confocal images and quantification of 144 hpf Tg(myl7:mCherry-CAAX); TgBAC(tcf21:NLS-EGFP); TgBAC(tcf21:mCherry-NTR) DMSO and MTZ-treated larvae, showing the reduction of tcf21+ EpiCs attached to the ventricular myocardium after their late-onset ablation. Controls were pooled, including tcf21:NTR+ DMSO-treated and tcf21:NTR− MTZ-treated larvae (see Materials and Methods). Data show the mean±s.d. (D,I) and P-values are from one-way ANOVA with Dunnett's post hoc test (D) or unpaired two-tailed t-test (I). A, atrium; V, ventricle. PHENOTYPE:
|
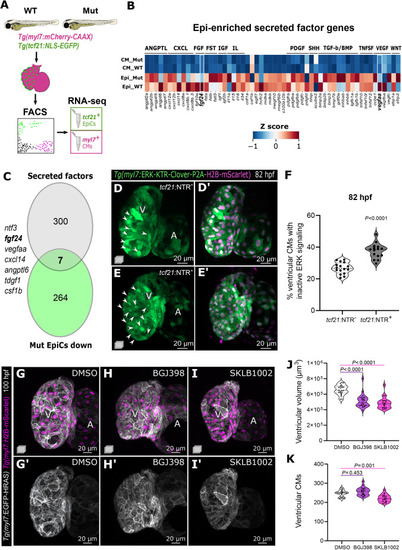
Epicardial-enriched FGF and VEGF ligand genes in epicardial-myocardial crosstalk. (A) RNA-seq from tcf21+ and myl7+ cells from 96 hpf tcf21+/+ and tcf21−/− hearts. (B) Heatmap of zebrafish secreted factor genes in tcf21+/+ and tcf21−/− EpiCs and CMs, showing Z-scores normalized per row. The genes highlighted in bold are differentially expressed between tcf21+/+ and tcf21−/− EpiCs (log2FC<−0.7 or >0.7, Padj<0.05). (C) Venn diagram denoting the intersection between secreted factor genes in the zebrafish genome and genes that are downregulated (log2FC<−0.7, Padj<0.05) in tcf21−/− EpiCs. (D-F) Confocal images and quantification of 82 hpf Tg(myl7:ERK-KTR-Clover-P2A-H2B-mScarlet) ventricles in control (tcf21:NTR−) and TgBAC(tcf21:mCherry-NTR) (tcf21:NTR+) larvae treated with MTZ. White arrowheads point to CMs with nuclear Clover (inactive ERK), quantified in F. (G-K) Confocal images (G-I′), quantification of ventricular volume (J) and CM numbers (K) of 100 hpf larvae treated with FGFR (BGJ398) and VEGFR (SKLB1002) inhibitors starting at 65 hpf. The solid and dotted lines (F,J,K) indicate the median and quartiles, respectively, and P-values are from Kruskal-Wallis test with Dunn's post-hoc test. A, atrium; V, ventricle. PHENOTYPE:
|