
|
Fig. 4.
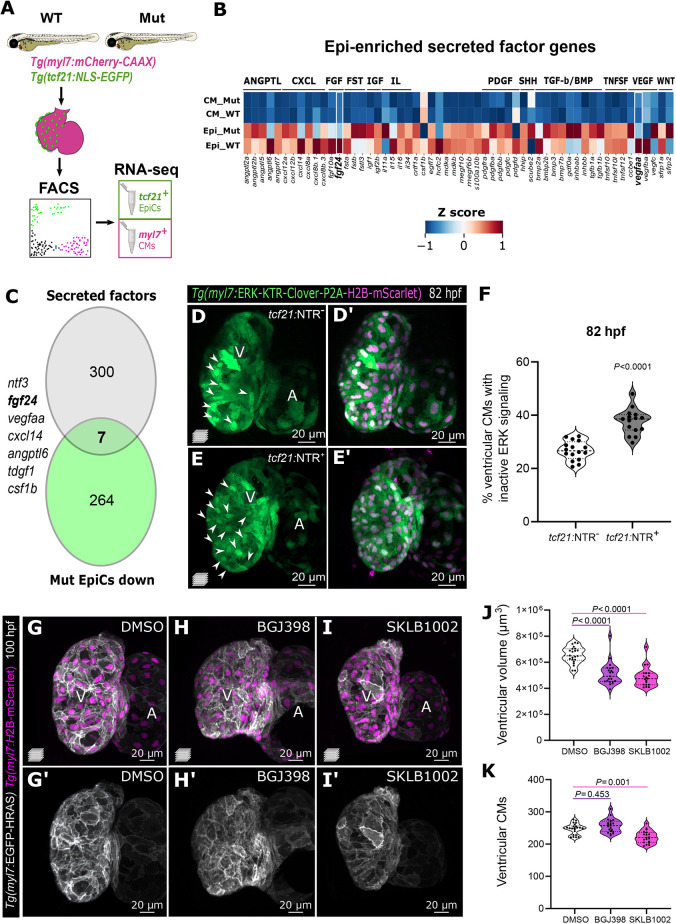
Epicardial-enriched FGF and VEGF ligand genes in epicardial-myocardial crosstalk. (A) RNA-seq from tcf21+ and myl7+ cells from 96 hpf tcf21+/+ and tcf21−/− hearts. (B) Heatmap of zebrafish secreted factor genes in tcf21+/+ and tcf21−/− EpiCs and CMs, showing Z-scores normalized per row. The genes highlighted in bold are differentially expressed between tcf21+/+ and tcf21−/− EpiCs (log2FC<−0.7 or >0.7, Padj<0.05). (C) Venn diagram denoting the intersection between secreted factor genes in the zebrafish genome and genes that are downregulated (log2FC<−0.7, Padj<0.05) in tcf21−/− EpiCs. (D-F) Confocal images and quantification of 82 hpf Tg(myl7:ERK-KTR-Clover-P2A-H2B-mScarlet) ventricles in control (tcf21:NTR−) and TgBAC(tcf21:mCherry-NTR) (tcf21:NTR+) larvae treated with MTZ. White arrowheads point to CMs with nuclear Clover (inactive ERK), quantified in F. (G-K) Confocal images (G-I′), quantification of ventricular volume (J) and CM numbers (K) of 100 hpf larvae treated with FGFR (BGJ398) and VEGFR (SKLB1002) inhibitors starting at 65 hpf. The solid and dotted lines (F,J,K) indicate the median and quartiles, respectively, and P-values are from Kruskal-Wallis test with Dunn's post-hoc test. A, atrium; V, ventricle.