
|
Fig. 1.
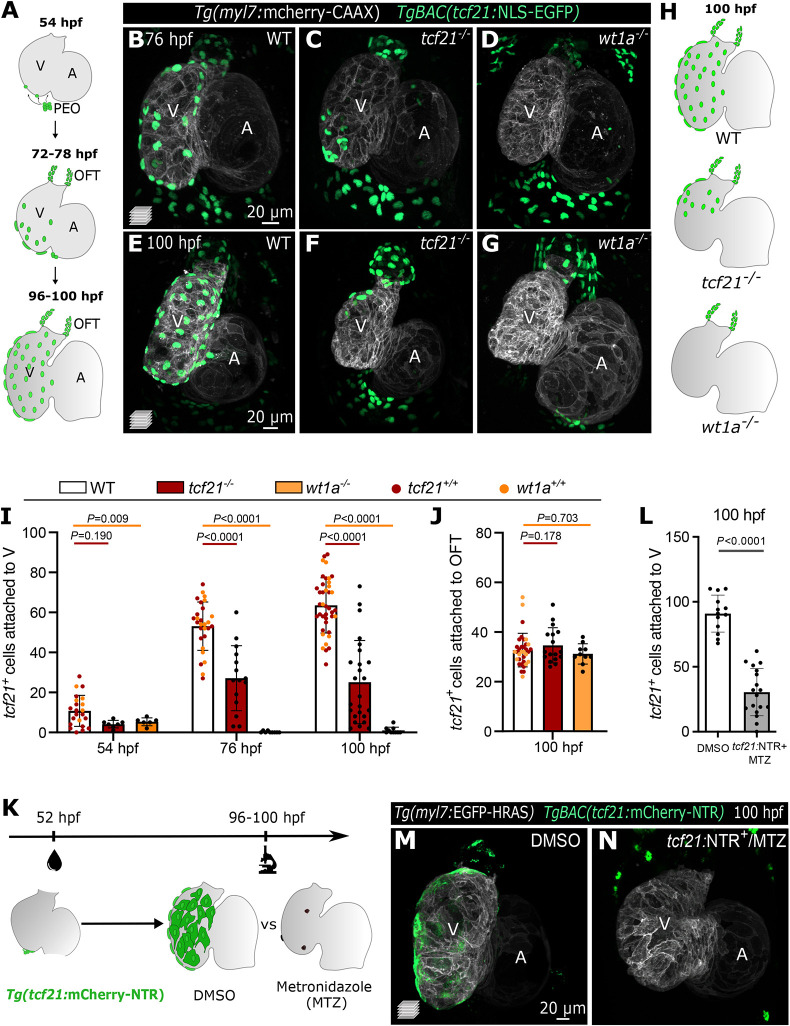
The transcription factors Tcf21 and Wt1a are required for epicardial attachment to the ventricle. (A) Schematic representation of the epicardial coverage of the zebrafish embryonic and larval heart. (B-G) Confocal images of 76 hpf (B-D) and 100 hpf (E-G) Tg(myl7:mCherry-CAAX) TgBAC(tcf21:NLS-EGFP) larvae. (H) Schematics of the epicardial coverage in 100 hpf WT, tcf21−/− and wt1a−/− larvae. Gray, myocardium; green, EpiCs. (I-J) Quantification of tcf21+ EpiCs attached to the ventricular myocardium (I) and OFT (J). The colors of WT dots refer to tcf21+/+ (red) and wt1a+/+ (orange) siblings. Data show the mean±s.d. P-values were determined from unpaired two-tailed t-test or Mann–Whitney test (following normality test) compared with +/+ siblings of each genotype. (K) Epicardial ablation protocol using the NTR/MTZ system. (L) Quantification of tcf21+ EpiCs attached to the ventricular myocardium following epicardial ablation. Data show the mean±s.d.; P-values were determined from unpaired two-tailed t-test. Controls are pooled tcf21:NTR+ DMSO-treated and tcf21:NTR− MTZ-treated larvae (see Materials and Methods). (M,N) Confocal images of 100 hpf Tg(myl7:EGFP-HRAS); TgBAC(tcf21:mCherry-NTR) hearts showing the absence of EpiCs post MTZ treatment (N), compared with DMSO-treated larvae (M). WT, wild type; A, atrium; V, ventricle; OFT, outflow tract; PEO, proepicardial organ.