
- Title
-
Zrsr2 Is Essential for the Embryonic Development and Splicing of Minor Introns in RNA and Protein Processing Genes in Zebrafish
- Authors
- Weinstein, R., Bishop, K., Broadbridge, E., Yu, K., Carrington, B., Elkahloun, A., Zhen, T., Pei, W., Burgess, S.M., Liu, P., Bresciani, E., Sood, R.
- Source
- Full text @ Int. J. Mol. Sci.
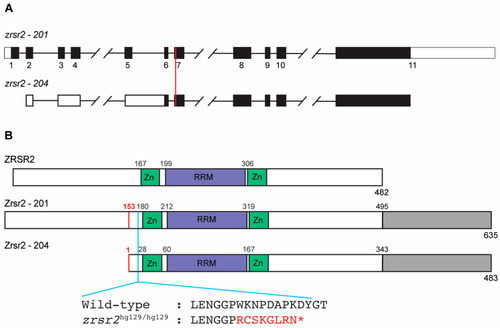
Genomic organization and functional domains of zebrafish Zrsr2. (A) A schematic of the genomic structures of zrsr2 isoforms 201 and 204, with exons shown as rectangles and introns as lines connecting the exons. Filled rectangles mark the coding sequence, and white rectangles mark the untranslated regions. The vertical red line marks the genomic target region of the sgRNA used for CRISPR/Cas9 knockout. (B) The alignment of the human ZRSR2 protein with isoforms 201 and 204 of zebrafish Zrsr2, showing the location of conserved functional domains: Zn = Zinc finger domains, RRM = RNA recognition motif. Gray color marks the extra C-terminal region in zebrafish Zrsr2. Black numbers indicate the amino acid number for the start of each domain. Red numbers mark the methionine at position 153 in isoform 201, which is the translation start site of Zrsr2-204. Blue line marks the location of the CRISPR/Cas9-induced mutation and partial amino acid sequences of WT and mutant proteins, with red color marking the frameshift and premature termination codon marked as *. |

zrsr2 expression during zebrafish embryonic development. (A) qRT-PCR data showing expression of zrsr2 isoforms using primers unique to each isoform, and total expression using primers common to both isoforms in WT embryos from a series of stages during development as marked across the bottom of each plot. (B) WISH with zrsr2 antisense probe, showing its sites of expression in WT embryos at 1 cell, 4 hpf, 24 hpf, 3 dpf, and 5 dpf as marked. Specific zrsr2 expression is seen in the developing brain (red arrow) and the peripheral blood island (blue arrow) at 24 hpf, and in the intestinal bulb (orange arrow) at 5 dpf. |
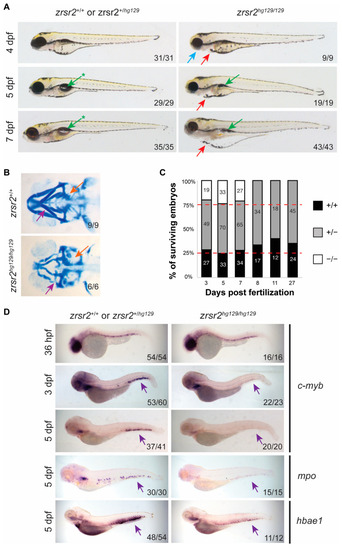
zrsr2-knockout embryos display morphological and hematopoietic defects. (A) Morphological phenotypes of zrsr2hg129/hg129 embryos at 4, 5, and 7 dpf are shown in the right panel compared to their WT siblings in the left panel. Blue arrow marks defective jaw, red arrows mark cardiac edema, green arrows mark uninflated swim bladder, and green arrows with asterisks mark the normal inflated swim bladder in WT embryos. All images depict lateral views of the embryos. (B) Ventral view of embryos stained with Alcian blue depicting the cartilage of developing jaw of WT embryos (top panel) and zrsr2hg129/hg129 embryos (bottom panel) at 4 dpf with purple arrows marking the mandibular cartilage and orange arrows marking the pharyngeal arches. (C) Survival of embryos collected from adult zrsr2hg129/+ in-cross. The bar graph displays the genotype ratios as a percentage of total sampled embryos, and red lines indicate the expected Mendelian offspring ratios (1:2:1; zrsr2+/+: zrsr2hg129/+: zrsr2hg129/hg129). Numbers in the bars represent the number of embryos of each genotype. Clutches were sampled for genotype makeup at multiple time points as marked on the X-axis. zrsr2hg129/hg129 embryos died by 8 dpf, while zrsr2hg129/+ and zrsr2+/+ embryos survived to adulthood. (D) WISH for definitive hematopoietic markers c-myb (36 hpf, 3 dpf, and 5 dpf), mpo (5 dpf) and hbae1 (5 dpf), showing expression in zrsr2hg129/hg129 embryos (right panel) compared to their siblings (left panel). Lateral views of embryos are shown in all images, with purple arrows marking the CHT region, showing reduced expression in zrsr2hg129/hg129 embryos. |
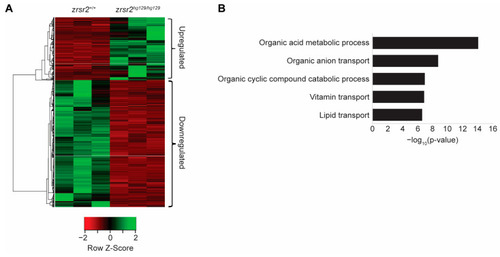
Loss of zrsr2 leads to global gene expression changes in metabolic processes. (A) Heatmap of the differentially expressed genes in zrsr2hg129/hg129 embryos compared to their WT controls at 3 dpf, with the color key shown below the heatmap. An amount of 455 genes were upregulated, and 917 genes were downregulated in the zrsr2hg129/hg129 samples (fold change ≥ 2, p < 0.05). (B) Bar graph of the top 5 biological processes enriched among 917 downregulated genes in zrsr2hg129/hg129 embryos at 3 dpf, with enrichment visualized by −log10 (p-value). Metabolic processes and transport of ions, vitamins, and lipids are among the most significantly enriched pathways among the downregulated genes. |

Loss of zrsr2 leads to the differential retention of U12-type introns in RNA and protein processing genes. (A) Pie charts depicting the classifications for all differentially retained introns between zrsr2hg129/hg129 and WT embryos into U12-type (blue) and U2-type (orange) introns (left) and the further classification of the retained U2-type introns (right) by whether they are adjacent to a known U12-type intron (green) or not adjacent but in a gene with a U12-type intron (purple), or in a gene with no known U12-type introns (grey). Some of the retained introns could not be classified into either category (yellow). (B) Plots of intron size distribution in the retained U12-type introns (left) and the non-retained U12-type introns (right). (C) The top 10 biological processes enriched in all genes (612) containing U12-type introns in the zebrafish genome according to IAOD. (D) The top 10 biological processes enriched in the set of U12-type intron containing genes (221) that have a differential IR between WT and zrsr2hg129/hg129 embryos at 3 dpf, with enrichment visualized by −log10 (p-value). Five of the ten top pathways (written in red) are common in both gene sets (C,D). |

ZFIN is incorporating published figure images and captions as part of an ongoing project. Figures from some publications have not yet been curated, or are not available for display because of copyright restrictions. EXPRESSION / LABELING:
|
|
ZFIN is incorporating published figure images and captions as part of an ongoing project. Figures from some publications have not yet been curated, or are not available for display because of copyright restrictions. EXPRESSION / LABELING:
PHENOTYPE:
|
|
ZFIN is incorporating published figure images and captions as part of an ongoing project. Figures from some publications have not yet been curated, or are not available for display because of copyright restrictions. |
|
Unillustrated author statements PHENOTYPE:
|