FIGURE SUMMARY
Title

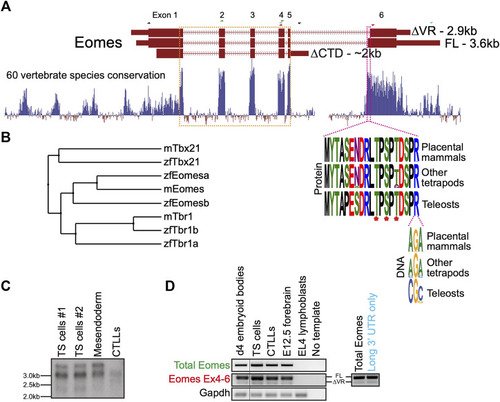
Eomes function is conserved between zebrafish and mouse and controls left-right organiser progenitor gene expression via interlocking feedforward loops

Authors
Talbot, C.D., Walsh, M.D., Cutty, S.J., Elsayed, R., Vlachaki, E., Bruce, A.E.E., Wardle, F.C., Nelson, A.C.
Source
Full text @ Front Cell Dev Biol

Mouse Eomes has multiple isoforms, including a mammalian-specific alternative splicing event. (A) Gene model with conservation track and sequence logos for variant region. All transcripts are Ensembl version 107 annotations - ∆VR transcript is ENSMUST00000111763; FL transcript is ENSMUST00000035020; ∆CTD transcript is ENSMUST00000150633. Annotated transcript sizes are indicated, as well as amino acid conservation of the VR between placental mammals, other tetrapods and teleosts, and the variation within the terminal VR arginine codon. The VR is defined by the amino acids present in ENSMUSP00000035020 (encoded by ENSMUST00000035020) that are absent from ENSMUSP00000107393 (encoded by ENSMUST00000111763). The T-box is outlined in orange and the VR in pink. Asterisks indicate known phosphorylated amino acid residues. RT-PCR primer pairs are indicated as half arrows and colour-coded as follows: black–to establish connectivity between the annotated start codon and ∆CTD isoform 3′ UTR; green–to assess total Eomes through amplification of exon 2–4; blue–to amplify Eomes cDNA between exon 4 and the distal 3′ UTR; red–to assess alternate splicing at exon 6. (B) BLOSUM62 average distance evolutionary tree of the Tbr1 subfamily showing relationships between mouse and zebrafish genes. (C) Northern blot showing Eomes transcripts in different cell types using a probe against the T-box. Data for two independent trophoblast stem (TS) cell lines are shown. Mesendoderm is P19Cl6 cells after 4 days of DMSO induced differentiation. CTLLs are IL-2-dependent T-cell lymphocytes derived from ATCC TIB-214. (D) RT-PCR showing relative levels of FL and ∆VR isoforms (left), and nested PCR showing FL/∆VR ratio for long 3′ UTR transcripts (right). Day 4 differentiated embryoid bodies contain cells mimicking embryonic endoderm. CTLLs are IL-2-dependent T-cell lymphocytes derived from ATCC TIB-214. EL4 cells are a negative control for Eomes expression. Gapdh is a loading control. Locations of primer pairs used for RT-PCR are shown in panel A and the text colour-coded accordingly. Nested PCR to analyse exon 6 splicing in transcripts containing the long 3′UTR was performed using the blue primer pair in panel A, followed by the red primer pair.

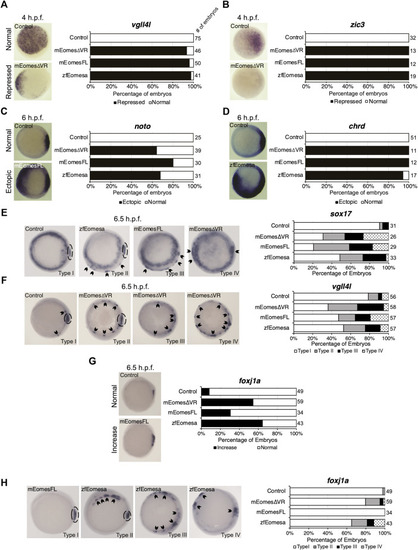
Both FL and ∆VR isoforms of mouse Eomes are functionally equivalent to zebrafish Eomesa in the early embryo. WISH analysis of ectoderm markers vgll4l and zic3 in mid/late blastulas (4 h.p.f.) embryos (A,B), organiser markers noto and chrd(C,D) in early gastrulas (6 h.p.f.), or DFC markers sox17, vgll4l and foxj1a(E–H) in early/mid gastrulas (6.5 h.p.f.). Embryos have been injected at the 1 cell stage to overexpress either mouse EomesFL, Eomes∆VR or zebrafish Eomesa. N = 2. Total numbers of embryos scored per condition are indicated. Representative images of expression patterns per gene per category are shown. (A–D) Animal views; dorsal to the right. (E) Animal views; dorsal to the right. (F–H) Vegetal views; dorsal to the right. Panel G indicates the percentage of embryos with greater intensity of dorsal foxj1a WISH staining, while panel H indicates percentages of embryos with ectopic foxj1a staining. Type I–wild type expression; Type II–ectopic dorsolateral expression with clear primary dorsal DFC cluster; Type III–dorsolateral expression with no defined primary cluster; Type IV–ectopic expression in the ventral margin. Dotted ovals indicate primary DFC clusters. Arrowheads indicate ectopic DFC marker expression.

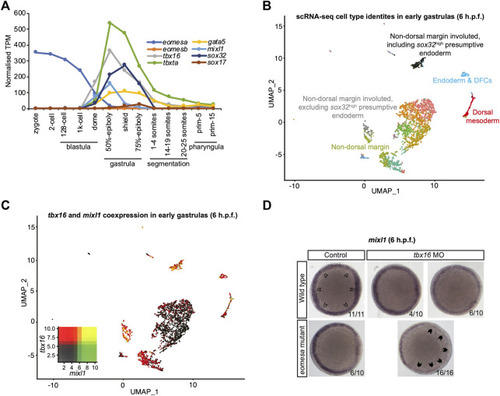
Eomesa and Tbx16 are redundantly required for mixl1 expression in the presumptive endoderm. (A) Timing of expression of T-box factors (eomesa, eomesb, tbxta, tbx16) under study and presumptive endoderm (mixl1, gata5, sox32) and endoderm markers (gata5, sox32, sox17) indicated by bulk RNA-seq data from (White et al., 2017). Gene expression is shown as transcripts per million (TPM). Stages are as defined by (Kimmel et al., 1995). (B) UMAP clustering analysis of single-cell RNA-seq data for early gastrulas (6 h.p.f.) zebrafish embryos (Wagner et al., 2018) indicating colour-coded cell type identities. Cell types relevant to the present study are labelled. The identities of all cell types are indicated in Supplementary Figure S3. (C) UMAP clustering analysis of single-cell RNA-seq data for early gastrulas (6 h.p.f.) zebrafish embryos indicating co-expression of tbx16 and mixl1 (Wagner et al., 2018). Heatmap insets indicate overall expression levels per gene and co-expression. Overlapping expression is shown in yellow. (D) WISH analysis of mixl1 in early gastrulas (5.7–6 h.p.f.) zebrafish embryos in wild type or eomesa mutant embryos (see Methods for information on genotype) with and without Tbx16 morpholino knockdown. Total numbers of embryos and fractions as categorised are indicated. Animal views; dorsal to the right. Open arrowheads indicate normal mixl1 expression at the blastoderm margin. Closed arrowheads indicate profound loss of mixl1 expression on tbx16 knockdown in eomesa mutants.

Tbx16 is substantially co-expressed with sox32 but cannot induce it in combination with mixl1 and gata5. (A,B) UMAP clustering plots of whole embryo single-cell RNA-seq data in early gastrulas (6 h.p.f.) indicating co-expression of sox32 with tbxta and tbx16. Heatmap insets indicate overall expression levels per gene and co-expression. Overlapping expression is shown in yellow. (C) WISH analysis of the ability of eomesa, eomesaN320K and tbx16 in combination with gata5 and mixl to induce sox32 expression at the animal pole of early gastrulas (6 h.p.f.). N = 2. Total numbers of embryos scored per condition are indicated. Representative images of expression patterns per gene per category are shown. Animal views; dorsal to the right. Arrowheads indicate ectopic expression. Fisher’s Exact two-tailed probability test p values: **P ≤ 5 × 10⁻⁶; ***P ≤ 5 × 10⁻¹².

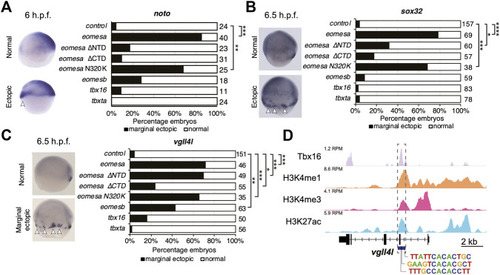
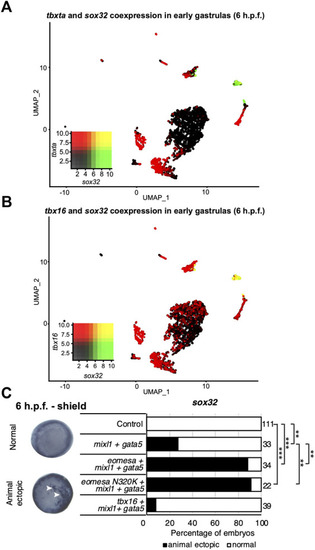
Eomesa is a more potent inducer of endoderm, organiser and dorsal forerunner cell markers than other T-box factors. (A–C) WISH analysis of dorsal mesoderm marker noto(A) and dorsal forerunner cell markers sox32(B) and vgll4l(C) on overexpression of various wild type and mutant T-box factors. mRNAs injected at the 1 cell stage; WISH performed at stages as indicated. N = 2. Total numbers of embryos scored per condition are indicated. Representative images of expression patterns per gene per category are shown. Lateral views; dorsal to the right. Arrowheads indicate ectopic expression. Fisher’s Exact two-tailed probability test p values: *P ≤ 5 × 10⁻⁴; **P ≤ 5 × 10⁻⁶; ***P ≤ 5 × 10⁻¹²; ****P ≤ 5 × 10⁻³⁰. (D) ChIP-seq data in mid/late gastrulas (8–8.5 h.p.f.) indicating Tbx16 binding within the vgll4l promoter (Bogdanovic et al., 2012; Nelson et al., 2017). Scale is reads per million reads (RPM). Putative T-box binding sites identified using JASPAR are indicated (Fornes et al., 2020).

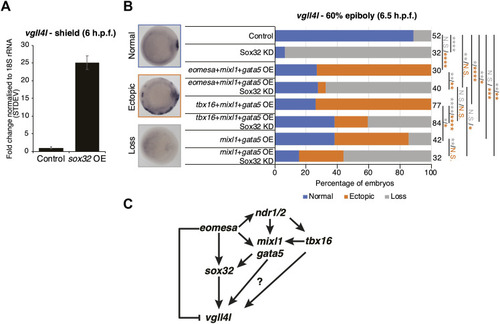
Eomesa activation of vgll4l is through feedforward loops via sox32 and its upstream activators. (A) qRT-PCR analysis of vgll4l expression in early gastrulas (6 h.p.f.) in control embryos and those injected with sox32 mRNA at the 1 cell stage. Expression is represented as fold change relative to control normalised to 18S rRNA. (B) WISH analysis of the ability of vgll4l expression in early gastrulas (6 h.p.f.) in embryos injected with mRNAs at the one-cell stage as indicated, with and without Sox32 morpholino knockdown. N = 2. Total numbers of embryos scored per condition are indicated. Representative images of expression patterns per gene per category are shown. Animal views; dorsal to the right. Fisher’s Exact two-tailed probability test p values: *P ≤ 5 × 10⁻²; **P ≤ 5 × 10⁻⁴; ***P ≤ 5 × 10⁻⁸; ****P ≤ 5 × 10⁻¹²; N.S. = not significant. Orange asterisks indicate significant differences in fractions of embryos exhibiting ectopic expression vs. other categories. Grey asterisks indicate significant differences in fractions of embryos exhibiting loss of expression vs. other categories. (C) Model for Eomesa regulation of vgll4l expression in dorsal forerunner cells indicating a type 3 incoherent feedforward loop on the left as Eomesa represses vgll4l directly while activating via Sox32, and potential type 1 coherent feedforward loops on the right as Eomesa activates positive regulators of sox32 and potentially also vgll4l.

Acknowledgments
This image is the copyrighted work of the attributed author or publisher, and ZFIN has permission only to display this image to its users. Additional permissions should be obtained from the applicable author or publisher of the image. Full text @ Front Cell Dev Biol