IMAGE

FIGURE 4

ID
ZDB-IMAGE-220923-59
Source
Figures for Talbot et al., 2022
Image
Figure Caption

FIGURE 4

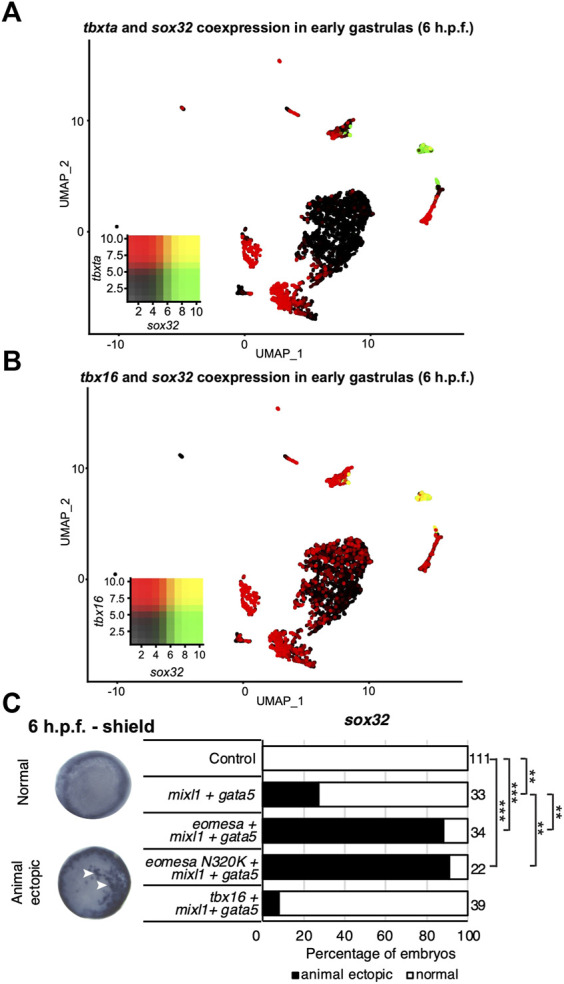
Tbx16 is substantially co-expressed with sox32 but cannot induce it in combination with mixl1 and gata5. (A,B) UMAP clustering plots of whole embryo single-cell RNA-seq data in early gastrulas (6 h.p.f.) indicating co-expression of sox32 with tbxta and tbx16. Heatmap insets indicate overall expression levels per gene and co-expression. Overlapping expression is shown in yellow. (C) WISH analysis of the ability of eomesa, eomesaN320K and tbx16 in combination with gata5 and mixl to induce sox32 expression at the animal pole of early gastrulas (6 h.p.f.). N = 2. Total numbers of embryos scored per condition are indicated. Representative images of expression patterns per gene per category are shown. Animal views; dorsal to the right. Arrowheads indicate ectopic expression. Fisher’s Exact two-tailed probability test p values: **P ≤ 5 × 10⁻⁶; ***P ≤ 5 × 10⁻¹².

Acknowledgments
This image is the copyrighted work of the attributed author or publisher, and ZFIN has permission only to display this image to its users. Additional permissions should be obtained from the applicable author or publisher of the image. Full text @ Front Cell Dev Biol