
- Title
-
An anti-inflammatory activation sequence governs macrophage transcriptional dynamics during tissue injury in zebrafish
- Authors
- Denans, N., Tran, N.T.T., Swall, M.E., Diaz, D.C., Blanck, J., Piotrowski, T.
- Source
- Full text @ Nat. Commun.

a Schematics of neomycin regime and time point collections for the macrophage recruitment assay in the Tg(she:lck-mScarletI;mpeg:GFP) larvae. b Representative confocal images (projection of a 30 mm z-stack) for the macrophage recruitment assay. c, d Quantification of macrophages around (c) or inside (d) the neuromast. Each dot represents the number of macrophages per neuromast (3 neuromasts per larvae, 16 larvae per condition and 3 biological replicates). A 2-way ANOVA followed by a Tukey multiple comparison tests has been used to determine statistical significance. P-values represent a post-hoc (Tukey) test from each condition relative to homeostasis. e Quantification of the distance from the neuromast prior to HC death of effector and non-effector macrophages. Each dot represents a macrophage (8 larvae per condition and 3 biological replicates). P-value represents a two-tailed Student’s t-test. f Quantification of the distance from the neuromast over-time after HC death of effector and non-effector macrophages (8 larvae per condition and 3 biological replicates). g Quantification of the macrophage velocity of effectors and non-effectors macrophages. Each dot represents a macrophage (8 larvae per condition and 3 biological replicates). A 2-way ANOVA followed by a Tukey multiple comparison test has been used to determine statistical significance. P-values represent a post-hoc (Tukey) test between each condition. h Representative confocal images (projection of a 30 mm z-stack) for the macrophage photoconversion assay. Cells photoconverted (red) were inside the neuromast at the time of photoconversion while non-photoconverted cells (cyan) were not. Orange dotted line represents the photoconverted area. i Quantification of the ratio of photoconverted effector macrophages over time. Each dot represents the percentage of macrophages per neuromast (1 neuromast per larvae, 12 larvae per condition and 3 biological replicates). For all graphs, data are represented as mean ± SD except for (f) which is represented as mean ± SEM. |
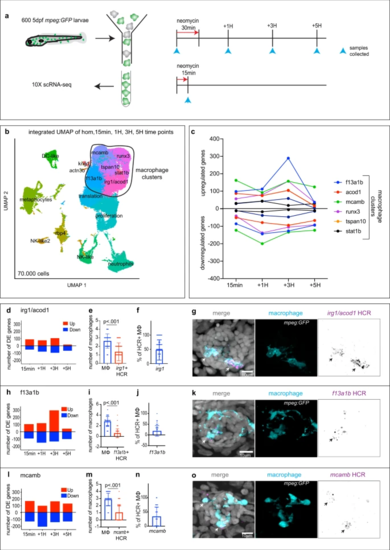
a Schematics of neomycin regime and time points collection for scRNA-seq. b Integrated UMAP of the five time points (1 experiment per time point). Cluster names are labeled on the UMAP. Macrophage clusters are circled. c Quantification of genes differentially up- and downregulated at each time point within the macrophages clusters. d, h, l Quantification of genes differentially up- and downregulated at each time point for (d) the ‘irg1/acod1’, (h) ‘f13a1b’ and (l) ‘mcamb’ clusters. e, i, m Quantifications of effector macrophages (MΦ) that either express (e) irg1/acod1, (i) f13a1b or (m) mcamb by HCR at 1H. Each dot represents the number of macrophages per neuromast (5 neuromasts per larvae, 16 larvae and 3 biological replicates). P-values represent non-parametric two-tailed Student’s t-test. f, j, n Quantifications of the percentage of HCR + effector macrophages (MΦ) in the (f) irg1/acod1, (j) f13a1b and (n) mcamb clusters. Each dot represents the number of effector macrophages per neuromast (5 neuromasts per larvae, 16 larvae and 3 biological replicates). g, k, o Representative confocal images (projection of a 30 μm z-stack) of HCR-FISH (arrows) within the effector macrophages for (g) irg1/acod1, (k) f13a1b and (o) mcamb (from 5 neuromasts per larvae, 16 larvae and 3 biological replicates). For all graphs, data are represented as mean ± SD. |
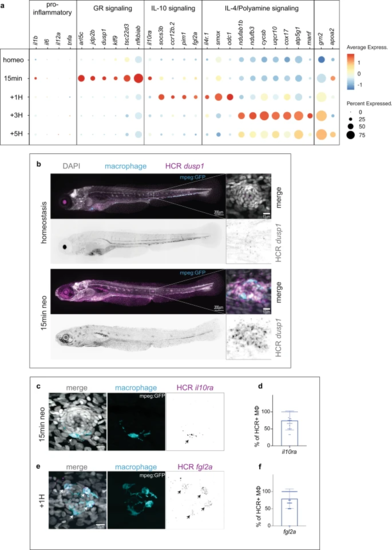
a Dot-Plot of selected differentially upregulated genes for each time point of the scRNA-seq time course within the effector population. b Representative confocal images (Maximum projection of a 200 μm z-stack) of an HCR-FISH for dusp1 in a 5dpf larvae (left) and zoom image of a representative neuromast (right) (from 6 whole larvae at 5dpf for homeostasis and 6 whole larvae at 5dpf after 15 min neo treatment. 2 biological replicates). c, e Representative confocal images (projection of a 30 μm z-stack) of HCR-FISH within the effector macrophages (arrows) for (c) il10ra, (e) fgl2a. d, f Quantifications of the percentage of HCR + effector macrophages (MΦ) for (d) il10ra, (f) fgl2a. (12 larvae with 3 neuromasts per larva and 3 biological replicates). For all graphs, data are represented as mean ± SD. |
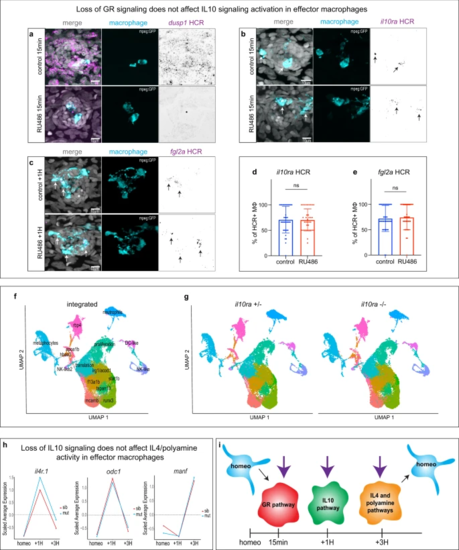
a Representative confocal images (maximum projection of a 30 μm z-stack) of an HCR-FISH for dusp1 in a neuromast (10 larvae per condition, 30 neuromasts total and 3 biological replicates). b, c Representative confocal images (projection of a 30 μm z-stack) of HCR-FISH within the effector macrophages (arrows) for (b) il10ra and (c) fgl2a (12 larvae per conditions, 36 neuromasts total and 3 biological replicates) d, e Quantifications of the percentage of HCR + effector macrophages (MΦ) for (d) il10ra and (e) fgl2a (12 larvae per conditions, 36 neuromasts total and 3 biological replicates). For all graphs, data are represented as mean ± SD. f Integrated UMAP of the six datasets for the il10ra mutant. Cluster names are labeled on the UMAP. g Split UMAP per condition (il10ra ± and il10ra-/-). h Line plots representing the average expression for each time point between the il10ra mutant (cyan) and the sibling (red) from the scRNA-seq integrated dataset. i Model of independent activation of the three anti-inflammatory pathways in effector macrophages during the HC regeneration time course. Resting macrophages are represented in cyan. Purple arrows represent the independent induction of each macrophage activation state. |

a, d, g Representative confocal images (maximum projection of a 10 μm z-stack) of the HC and efferent synapse regeneration assay. b, e, h Quantification of HC numbers during (b) homeostasis, (e) 24H after HC death and (h) 48H after HC death (11–14 larvae per condition, 3 neuromasts per larvae and 4 biological replicates). c, f, i Quantification of the number of efferent synapses per HC (ratio) during (c) homeostasis, (f) 24 h after HC death and (i) 48H after HC death (8–14 larvae per condition, 3 neuromasts per larvae and 4 biological replicates). A 2-way ANOVA followed by a Tukey multiple comparison test has been used to determine statistical significance. P-values represent a post-hoc test (Tukey) between each condition. For all graphs, data are represented as mean ± SD. |