
- Title
-
A proliferative to invasive switch is mediated by srGAP1 downregulation through the activation of TGF-β2 signaling
- Authors
- Mondal, C., Gacha-Garay, M.J., Larkin, K.A., Adikes, R.C., Di Martino, J.S., Chien, C.C., Fraser, M., Eni-Aganga, I., Agullo-Pascual, E., Cialowicz, K., Ozbek, U., Naba, A., Gaitas, A., Fu, T.M., Upadhyayula, S., Betzig, E., Matus, D.Q., Martin, B.L., Bravo-Cordero, J.J.
- Source
- Full text @ Cell Rep.
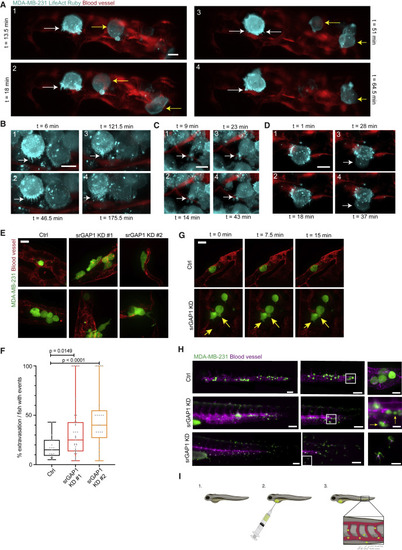
Figure 1. Breast cancer cells form protrusive structures during extravasation (A–D) Lattice light-sheet microscopy of MDA-MB-231 cells expressing LifeAct Ruby injected intravenously in zebrafish xenografts. Yellow arrows point toward rolling BC cells in the blood. White arrows point to: (A and B) protrusions toward endothelium; (C) protrusions into the endothelium; (D) protrusions formed by tumor cell after extravasation. Scale bar, 10 μm. Time in min. (E) Representative images of Ctrl, srGAP1 KD #1, and srGAP1 KD #2 MDA-MB-231-GFP cells injected into Tg(kdrl:RFP) zebrafish embryos and imaged 24 h post injection (hpi). Scale bar, 20 μm. (F) Percent of extravasated MDA-MB-231 cells from zebrafish with extravasation events. n = 19 (Ctrl), 37 (srGAP KD #1), and 21 (srGAP1 KD #2) zebrafish. Mann Whitney U test, two-tailed. Data represented as a box and whisker plot, with median and interquartile range in the box and min and max as whiskers. (G) Time-lapse images of MDA-MB-231 Ctrl and srGAP1 KD #1 cells in zebrafish vasculature. Yellow arrows point to protrusive structures. Scale bar, 20 μm. (H) Tiled images showing extravasation events at the tailbud of fish. MDA-MB-231 cells. (Top) Ctrl cells imaged 24 h post injection (hpi). (Middle) srGAP KD #1 cells imaged 20 hpi; (bottom) srGAP KD #1 cells imaged 24 hpi. Three representative fish tails shown. Scale bar, 100 μm (left and middle panels), 25 μm (right). (I) Schematic of zebrafish xenograft setup. |
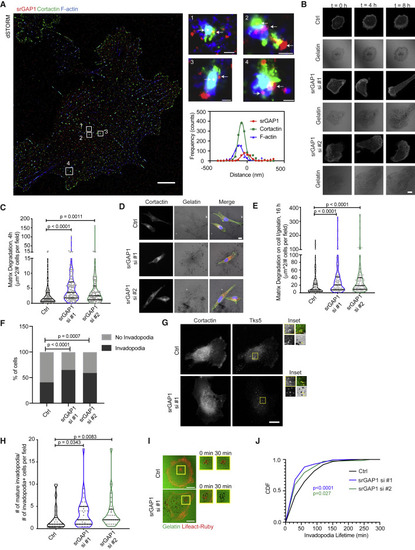
Figure 2. srGAP1 depletion increases matrix degradation by forming more mature invadopodia (A) Immunofluorescence demonstrating srGAP1, cortactin, and F-actin localization at invadopodia structures using direct STORM of MDA-MB-231 cells. Individual invadopodia noted by numbers and white boxes; arrows point to srGAP1 staining. Scale bars, 5 μm (for cell), 100 nm (for invadopodia #1, 4), 200 nm (for invadopodia #2, 3). For invadopodia #1, respective curve fitting of a region through invadopodia (bottom right). (B) Time-lapse images of control (Ctrl) or srGAP1 knockdown Lifeact-Ruby MDA-MB-231 cells using siRNAs (srGAP si #1, srGAP1 si #2) and respective matrix degradation on gelatin at 0, 4, and 8 h. Scale bar, 10 μm. (C) Matrix degradation of Ctrl, srGAP1 si #1, and srGAP1 si #2 MDA-MB-231 cells. Cells plated on fluorescent gelatin for 4 h. n = 114 (Ctrl), 116 (srGAP1 si #1), and 109 (srGAP1 si #2) fields quantified. Data from three independent experiments and represented as a violin plot, horizontal lines are median and interquartile range. Mann-Whitney U test, two-tailed. (D) Representative images of Ctrl, srGAP1 si #1, and srGAP1 si #2 MDA-MB-231 cells plated on fibrillar collagen I overlaid on fluorescent gelatin for 16 h. Left: cortactin; middle: gelatin matrix; right: cortactin (red)-, F-actin (green)-, DAPI (blue)-labeled tumor cells on the matrix. Scale bar, 10 μm. (E) Matrix degradation of Ctrl, srGAP1 si #1, and srGAP1 si #2 MDA-MB-231 cells plated on fibrillar collagen I overlaid on fluorescent gelatin for 16 h. n = 119 (Ctrl), 101 (srGAP1 si #1), and 113 (srGAP1 si #2) fields quantified. Data are from three independent experiments and represented as a violin plot; horizontal lines are median and interquartile range. Mann-Whitney U test, two-tailed. (F) Percent of Ctrl, srGAP1 si #1, and srGAP1 si #2 MDA-MB-231 cells with or without invadopodia at 4 h. n = 226 cells from 64 fields (Ctrl), 166 cells from 73 fields (srGAP1 si #1), 147 cells from 72 fields (srGAP1 si #2) pooled over three independent experiments. Chi-squared test. (G) Representative images of Ctrl and srGAP1 si #1 MDA-MB-231 cells on gelatin for 4 h. Left: cortactin; right: Tks5 staining. Scale bar, 10 μm. Inset scale bar, 1 μm. Top left: cortactin; bottom left: Tks5; bottom right: gelatin, Top right: merge of cortactin and Tks5. Mature invadopodia are labeled with cortactin and Tks5; black spots on gelatin matrix represent matrix degradation (yellow arrows point to colocalization of invadopodia and matrix degradation). (H) Number of mature invadopodia of Ctrl, srGAP1 si #1, and srGAP1 si #2 MDA-MB-231 cells at 4 h, n = 25 (Ctrl), n = 33 (srGAP1 si #1), n = 28 (srGAP1 si #2) fields. Data are from three independent experiments and represented as a violin plot; horizontal lines are median and interquartile range. Mann-Whitney U test, two-tailed. (I) Time-lapse images of invadopodia lifetime at 0 and 30 min. (Left) Lifeact-Ruby Ctrl and srGAP1 si #1 MDA-MB-231 cells on fluorescent gelatin at 0 min. Scale bar, 20 μm. Right panel: insets of mature invadopodia (red fluorescent puncta overlaid on black degradation spots) over time (0 and 30 min). (J) Cumulative distribution of invadopodia lifetimes of Ctrl, srGAP1 si #1, and srGAP1 si #2 MDA-MB-231 cells. n = 122 invadopodia from 10 cells (Ctrl), 317 invadopodia from 11 cells (srGAP1 si #1), and 169 invadopodia from 11 (srGAP1 si #2) cells. Data from three independent experiments. Kolmogorov-Smirnov test. |
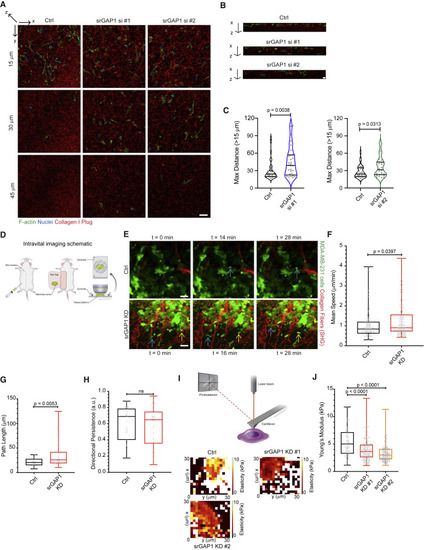
Figure 3. In vitro and in vivo invasion are regulated by srGAP1 expression (A) Representative images of Ctrl, srGAP1 si #1, and srGAP1 si #2 MDA-MB-231 cells 3 days after being seeded on top of collagen I plugs. Images taken at 15, 30, and 45 μm in the z direction (deeper into collagen plug away from surface). Cells are labeled with phalloidin and DAPI, collagen I is fluorescently labeled. Scale bar, 50 μm. (B) x-z images of representative collagen I plugs from (A). Scale bar, 10 μm. (C) Maximum distance (>15 μm) Ctrl and srGAP1 si #1 cells (left) or Ctrl and srGAP1 si #2 MDA-MB-231 cells (right) invade into the collagen I plug. Each value is a single cell/field. Left: n = 37 (Ctrl), 34 (srGAP1 si #1) cells. Right: n = 38 (Ctrl), 35 (srGAP1 si #2) cells. Data pooled over five independent experiments and represented as a violin plot; horizontal lines are median and interquartile range. Mann-Whitney U test, two-tailed. (D) Schematic of intravital imaging setup. (E) Three individual time frames from intravital imaging movies of Ctrl and srGAP1 KD #1 MDA-MB-231 primary tumors. Tumor cells in green, collagen fibers in red through second harmonic generation (SHG). Blue and yellow arrows indicate in vivo cell motility over time. One z slice shown at 0, 16, 28 min. Scale bar, 25 μm. (F) Average mean speed of tumor cells moving in μm/min in vivo from (C). Data pooled from 3 Ctrl and 3 srGAP1 KD #1 mice, n = 94 (Ctrl) and 102 (srGAP1 KD #1) MDA-MB-231 tumor cells. Mann-Whitney U test, two-tailed. Data represented as a box and whisker plot, with median and interquartile range in the box and min and max as whiskers. (G) Average path length of tumor cells that appear in a minimum of 10 frames of intravital imaging movies (t = 20–28 min). Data pooled from 3 Ctrl and 3 srGAP1 KD #1 mice, n = 27 (Ctrl) and 33 (srGAP1 KD #1) MDA-MB-231 tumor cells. Mann-Whitney U test, two-tailed. Data represented as a box and whisker plot, with median and interquartile range in the box and min and max as whiskers. (H) Directional persistence of tumor cells that appear in a minimum of 10 frames of intravital imaging movies (t = 20–28 min). Data pooled from 3 Ctrl and 3 srGAP1 KD #1 mice, n = 27 (Ctrl) and 33 (srGAP1 KD #1) MDA-MB-231 tumor cells. Mann-Whitney U test, two-tailed. Data represented as a box and whisker plot, with median and interquartile range in the box and min and max as whiskers. (I) Top: schematic of atomic force microscopy setup. Bottom: elasticity heatmaps of representative Ctrl, srGAP1 KD #1, and srGAP1 KD #2 MDA-MB-231 cells. (J) Modulus of elasticity of Ctrl, srGAP1 KD #1, and srGAP1 KD #2 MDA-MB-231 cells using AFM. n = 100 (Ctrl), 200 (KD #1), and 200 (KD #2) measurements over 4, 8, and 8 cells, respectively. Mann-Whitney U test, two-tailed. Data represented as a box and whisker plot, with median and interquartile range in the box and min and max as whiskers. |
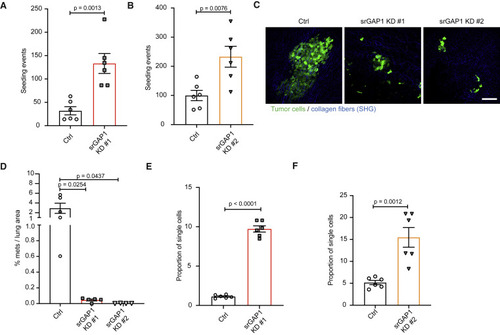
Figure 4. srGAP1low cells are capable of seeding the lung but have reduced metastatic outgrowth (A) Number of seeding events (single MDA-MB-231 tumor cells and clusters) relative to primary tumor mass (grams). Data pooled over two Ctrl and two srGAP1 KD #1 mice. Three 450 × 450 μm sections quantified per mouse. Unpaired t test, two-tailed, mean ± SEM. (B) Number of seeding events (single MDA-MB-231 tumor cells and clusters) relative to primary tumor mass (grams). Data pooled over two Ctrl and two srGAP1 KD #2 mice. Three 450 × 450 μm sections quantified per mouse. Unpaired t test, two-tailed, mean ± SEM. (C) Representative images of MDA-MB-231 lung metastasis in Ctrl, srGAP1 KD #1, and srGAP1 KD #2 mice. Maximum intensity z projection, tumor cells in green and collagen fibers in blue through second harmonic generation (SHG). Scale bar, 100 μm. (D) Percent area of MDA-MB-231 metastasis per lung area measured (in mm2). One H&E section measured per mouse, n = 5 (Ctrl), 5 (srGAP1 KD #1), and 4 (srGAP1 KD #2) mice. Unpaired t test, two-tailed, mean ± SEM. (E) Quantification of the proportion of MDA-MB-231 single cells relative to mass of primary tumor per lung section. Data pooled over two Ctrl and two srGAP1 KD #1 mice. Three 450 × 450 μm sections quantified per mouse. Unpaired t test, two-tailed, mean ± SEM. (F) Quantification of the proportion of MDA-MB-231 single cells relative to mass of primary tumor per lung section. Data pooled over two Ctrl and two srGAP1 KD #2 mice. Three 450 × 450 μm sections quantified per mouse. Unpaired t test, two-tailed, mean ± SEM. |
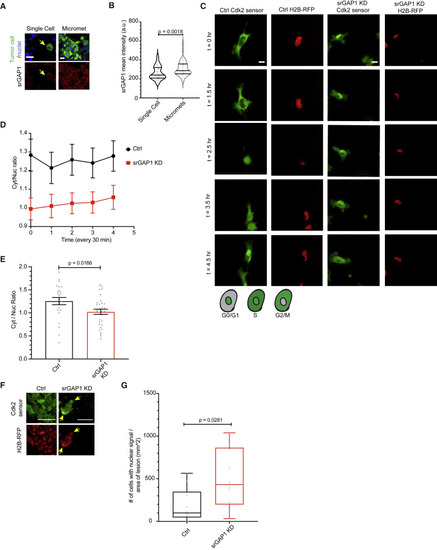
Figure 5. Solitary disseminated tumor cells have low srGAP1 expression (A) Tissue staining of MDA-MB-231 single tumor cells and clusters in Ctrl mice lungs. Yellow arrow points to single cell. Top: GFP-labeled tumor cell, DAPI for nuclei. Bottom: srGAP1 staining. Scale bar, 10 μm. (B) srGAP1 intensity of MDA-MB-231 tumor cells and clusters in Ctrl mice lung (mean intensity in a defined area calculated for individual tumor cells and clusters). Data pooled over two Ctrl mice, three 450 × 450 μm sections quantified per mouse. Mann Whitney U test, two-tailed. Scale bar, 10 μm. Data represented as a violin plot; horizontal lines are median and interquartile range. (C) Top: time-lapse imaging of MDA-MB-231 Ctrl and srGAP1 KD #1 cells expressing H2B-RFP and a DHB:Venus sensor for Cdk2 activity. Frames from live-cell imaging of cells plated on fibrillar collagen, time in hours. Scale bar, 10 μm. Bottom: schematic representing cells expressing DHB:Venus sensor: nuclear expression is G0/G1, nuclear and cytoplasmic expression is S, and cytoplasmic expression is G2/M. (D) Quantification of cytoplasmic to nuclear (C/N) ratio of DHB:Venus sensor for Cdk2 activity over time for MDA-MB-231 Ctrl and srGAP1 KD #1 cells from (C). n = 24 (Ctrl), 34 (srGAP1 KD #1) cells, two independent experiments. C/N ratio calculated for five frames (2 h). Data represented as mean ± SEM. (E) Average cytoplasmic to nuclear ratio of MDA-MB-231 Ctrl and KD #1 cells expressing the DHB:Venus sensor for Cdk2 activity and H2B-RFP. C/N calculated from live-cell imaging (averaged over 2 h) of cells plated on fibrillar collagen. n = 24 (Ctrl), 34 (srGAP1 KD #1) cells, two independent experiments. Unpaired t test, two-tailed. (F) Images of lungs from Ctrl and srGAP1 KD #1 MDA-MB-231 xenografts expressing H2B-RFP and a DHB:Venus sensor for Cdk2 activity. Scale bars, 50 μm (left), 10 μm (right). (G) Number of MDA-MB-231 cells in the lung with nuclear DHB:Venus sensor expression relative to lesion area. Ten fields of view (255 × 255 μm) per mouse, data pooled over one Ctrl and one srGAP1 KD #1 mouse, each point is a field. Mann-Whitney U test, two-tailed. Data represented as a box and whisker plot, with median and interquartile range in the box and min and max as whiskers. |
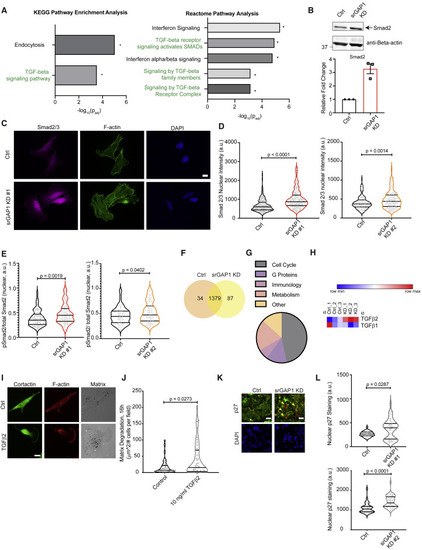
Figure 6. srGAP1low cells have increased Smad2 activation and TGF-β2 secretion (A) Left: KEGG pathway enrichment analysis; right: reactome pathway analysis of differentially expressed genes in srGAP1 KD #1 MDA-MB-231 tumors in relation to Ctrl tumors, ∗padj < 0.05. (B) Top: immunoblot of Smad2 in Ctrl and srGAP1 KD #1 MDA-MB-231 cells using an anti-Smad2/3 antibody. Loading control, anti-β-actin. Bottom: densitometry analysis of Smad2 protein levels in Ctrl and KD #1 cells, three biological replicates. (C) Immunofluorescence of Smad2/3 in Ctrl and srGAP1 KD #1 MDA-MB-231 cells. Left: Smad2/3. Middle: phalloidin staining for F-actin. Right: DAPI for nuclear staining. Scale bar, 10 μm. (D) Smad2/3 nuclear intensity per cell. Left: n = 170 (Ctrl), 171 (srGAP1 KD #1) MDA-MB-231 cells. Right: n = 151 (Ctrl) cells, n = 169 (srGAP1 KD #2) MDA-MB-231 cells. Data over three independent experiments, Mann-Whitney U test, two-tailed. Data represented as a violin plot; horizontal lines are median and interquartile range. (E) pSmad2/total Smad2 nuclear intensity ratio. Left: n = 90 (Ctrl), 94 (srGAP1 KD #1) MDA-MB-231 cells. Right: n = 80 (Ctrl), 99 (srGAP1 KD #2) MDA-MB-231 cells. Data over three independent experiments, Mann-Whitney U test, two-tailed. Data represented as a violin plot; horizontal lines are median and interquartile range. (F) Differential expression of proteins from secretome analysis of conditioned medium from srGAP1 KD #1 MDA-MB-231 cells in relation to conditioned medium from Ctrl cells. Data visualized as a Venn diagram, three biological replicates and two technical duplicates. (G) Pathway enrichment analysis of secretome (proteomics of conditioned medium) from srGAP1 KD #1 MDA-MB-231 cells in relation to conditioned medium from Ctrl cells. (H) Expression of TGF-β ligands from proteomics data comparing conditioned medium from Ctrl and srGAP1 KD #1 MDA-MB-231 cells. Each data point is a biological replicate (averaged technical duplicates). (I) Matrix degradation of MDA-MB-231 Ctrl cells plated on gelatin and stimulated with 10 ng/mL TGF-β2, 16 h. Left: cortactin. Middle: phalloidin stain for F-actin. Right: fluorescent gelatin matrix. Scale bar, 10 μm. (J) Matrix degradation of MDA-MB-231 Ctrl cells stimulated with 10 ng/mL TGF-β2 plated on gelatin, 16 h. Data from three independent experiments and represented as a violin plot, horizontal lines are median and interquartile range. n = 41 (Ctrl), 42 (TGF-β2-stimulated) fields quantified. Mann-Whitney U test, two-tailed. (K) Nuclear p27 staining intensity of MDA-MB-231 Ctrl and srGAP1 KD #2 primary tumors. Top: p27. Bottom: DAPI for nuclei. Scale bar, 10 μm. (L) Nuclear p27 staining intensity of MDA-MB-231 primary tumors. Top: data pooled over two Ctrl and two srGAP1 KD #1 mice. n = 39 (Ctrl) cells, n = 48 (srGAP1 KD #1) cells. Two 246 × 246 μm sections quantified per mouse. Mann-Whitney U test, two-tailed. Bottom: data pooled over two Ctrl and two srGAP1 KD #2 mice. One 388 × 388 μm section quantified per mouse. n = 38 (Ctrl) cells, n = 46 (srGAP1 KD #2) cells. Mann-Whitney U test, two-tailed. Data represented as a violin plot; horizontal lines are median and interquartile range. |
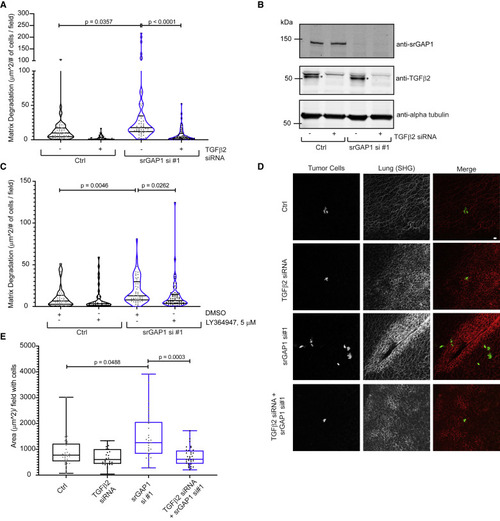
Figure 7. TGF-β2-mediated signaling regulates srGAP1low phenotypes (A) Matrix degradation of Ctrl and srGAP1 si #1 MDA-MB-231 cells with or without depletion of TGF-β2 by siRNA. Cells plated on fluorescent gelatin for 16 h. n = 51 (Ctrl), 47 (Ctrl + TGF-β2 siRNA), 52 (srGAP1 si #1), and 58 (srGAP1 si #1 + TGF-β2 siRNA) fields quantified. Data are from three independent experiments and represented as a violin plot, horizontal lines are median and interquartile range. Kruskal-Wallis test, corrected with Dunn’s test. (B) Immunoblot of Ctrl and srGAP1 si #1 MDA-MB-231 cells with or without depletion of TGF-β2 by siRNA. Top blot: anti-srGAP1. Middle blot: anti-TGF-β2, ∗ represents the TGF-β2 band. Bottom blot: loading control: anti-α-tubulin. (C) Matrix degradation of Ctrl and srGAP1 si #1 MDA-MB-231 cells with DMSO or 5 μM LY364947. Cells treated in serum-free medium with DMSO or 5 μM LY364947 for 24 h, then plated on fluorescent gelatin for 16 h with DMSO or 5 μM LY364947. n = 45 (Ctrl + DMSO), 38 (Ctrl +5 μM LY364947), 52 (srGAP1 si #1 + DMSO), and 61 (srGAP1 si #1 + 5 μM LY364947) fields quantified. Data are from three independent experiments and represented as a violin plot, horizontal lines are median and interquartile range. Kruskal-Wallis test, corrected with Dunn’s test. (D) Representative images of cells seeding the lung after tail-vein injections. Left panel: GFP-labeled MDA-MB-231 tumor cells. Middle panel: fibrillar collagen (second harmonic generation). Right panel: merge, tumor cells in green and fibrillar collagen in red. Scale bar, 20 μm. (E) Area of tumor cells that have extravasated into the lung per field containing cells. GFP-labeled MDA-MB-231 Ctrl and srGAP1 si #1 MDA-MB-231 cells with or without depletion of TGF-β2 by siRNA. Cells injected into the tail-vein of mice. n = 31 (Ctrl), 31 (Ctrl + TGF-β2 siRNA), 29 (srGAP1 si #1), and 25 (srGAP1 si #1 + TGF-β2 siRNA) fields quantified, pooled over 5, 5, 4, and 5 mice, respectively. Data are represented as a box and whisker plot; horizontal lines are median and interquartile range. Kruskal-Wallis test, corrected with Dunnett T3 test. |