
|
Fig. 4
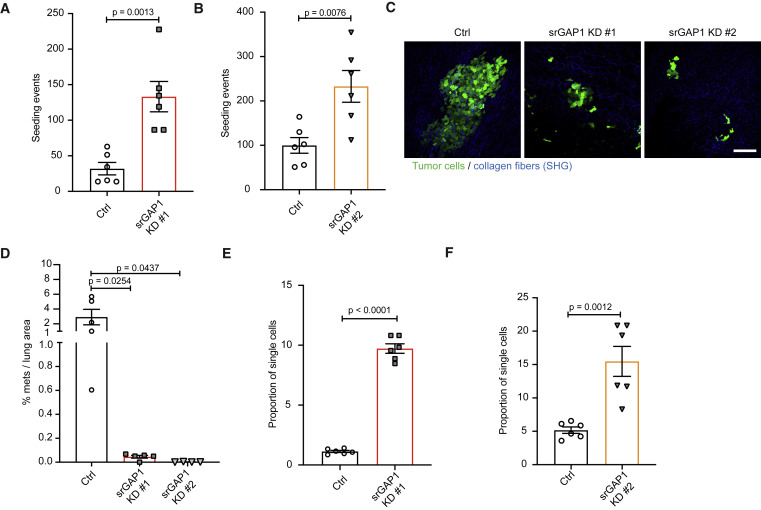
Figure 4. srGAP1low cells are capable of seeding the lung but have reduced metastatic outgrowth (A) Number of seeding events (single MDA-MB-231 tumor cells and clusters) relative to primary tumor mass (grams). Data pooled over two Ctrl and two srGAP1 KD #1 mice. Three 450 × 450 μm sections quantified per mouse. Unpaired t test, two-tailed, mean ± SEM. (B) Number of seeding events (single MDA-MB-231 tumor cells and clusters) relative to primary tumor mass (grams). Data pooled over two Ctrl and two srGAP1 KD #2 mice. Three 450 × 450 μm sections quantified per mouse. Unpaired t test, two-tailed, mean ± SEM. (C) Representative images of MDA-MB-231 lung metastasis in Ctrl, srGAP1 KD #1, and srGAP1 KD #2 mice. Maximum intensity z projection, tumor cells in green and collagen fibers in blue through second harmonic generation (SHG). Scale bar, 100 μm. (D) Percent area of MDA-MB-231 metastasis per lung area measured (in mm2). One H&E section measured per mouse, n = 5 (Ctrl), 5 (srGAP1 KD #1), and 4 (srGAP1 KD #2) mice. Unpaired t test, two-tailed, mean ± SEM. (E) Quantification of the proportion of MDA-MB-231 single cells relative to mass of primary tumor per lung section. Data pooled over two Ctrl and two srGAP1 KD #1 mice. Three 450 × 450 μm sections quantified per mouse. Unpaired t test, two-tailed, mean ± SEM. (F) Quantification of the proportion of MDA-MB-231 single cells relative to mass of primary tumor per lung section. Data pooled over two Ctrl and two srGAP1 KD #2 mice. Three 450 × 450 μm sections quantified per mouse. Unpaired t test, two-tailed, mean ± SEM.