
|
Fig. 3
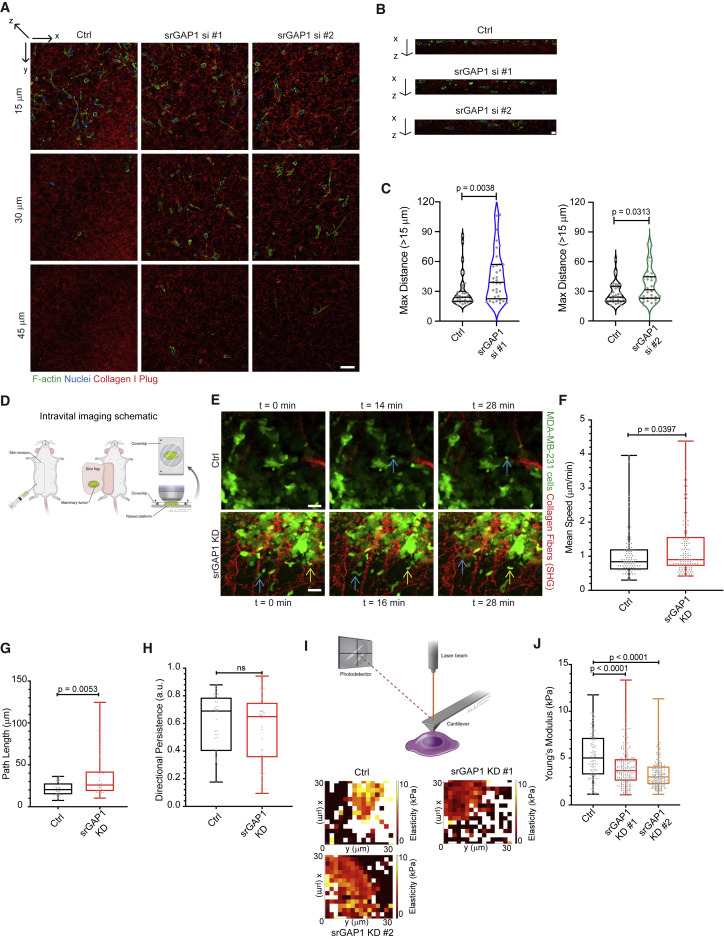
Figure 3. In vitro and in vivo invasion are regulated by srGAP1 expression (A) Representative images of Ctrl, srGAP1 si #1, and srGAP1 si #2 MDA-MB-231 cells 3 days after being seeded on top of collagen I plugs. Images taken at 15, 30, and 45 μm in the z direction (deeper into collagen plug away from surface). Cells are labeled with phalloidin and DAPI, collagen I is fluorescently labeled. Scale bar, 50 μm. (B) x-z images of representative collagen I plugs from (A). Scale bar, 10 μm. (C) Maximum distance (>15 μm) Ctrl and srGAP1 si #1 cells (left) or Ctrl and srGAP1 si #2 MDA-MB-231 cells (right) invade into the collagen I plug. Each value is a single cell/field. Left: n = 37 (Ctrl), 34 (srGAP1 si #1) cells. Right: n = 38 (Ctrl), 35 (srGAP1 si #2) cells. Data pooled over five independent experiments and represented as a violin plot; horizontal lines are median and interquartile range. Mann-Whitney U test, two-tailed. (D) Schematic of intravital imaging setup. (E) Three individual time frames from intravital imaging movies of Ctrl and srGAP1 KD #1 MDA-MB-231 primary tumors. Tumor cells in green, collagen fibers in red through second harmonic generation (SHG). Blue and yellow arrows indicate in vivo cell motility over time. One z slice shown at 0, 16, 28 min. Scale bar, 25 μm. (F) Average mean speed of tumor cells moving in μm/min in vivo from (C). Data pooled from 3 Ctrl and 3 srGAP1 KD #1 mice, n = 94 (Ctrl) and 102 (srGAP1 KD #1) MDA-MB-231 tumor cells. Mann-Whitney U test, two-tailed. Data represented as a box and whisker plot, with median and interquartile range in the box and min and max as whiskers. (G) Average path length of tumor cells that appear in a minimum of 10 frames of intravital imaging movies (t = 20–28 min). Data pooled from 3 Ctrl and 3 srGAP1 KD #1 mice, n = 27 (Ctrl) and 33 (srGAP1 KD #1) MDA-MB-231 tumor cells. Mann-Whitney U test, two-tailed. Data represented as a box and whisker plot, with median and interquartile range in the box and min and max as whiskers. (H) Directional persistence of tumor cells that appear in a minimum of 10 frames of intravital imaging movies (t = 20–28 min). Data pooled from 3 Ctrl and 3 srGAP1 KD #1 mice, n = 27 (Ctrl) and 33 (srGAP1 KD #1) MDA-MB-231 tumor cells. Mann-Whitney U test, two-tailed. Data represented as a box and whisker plot, with median and interquartile range in the box and min and max as whiskers. (I) Top: schematic of atomic force microscopy setup. Bottom: elasticity heatmaps of representative Ctrl, srGAP1 KD #1, and srGAP1 KD #2 MDA-MB-231 cells. (J) Modulus of elasticity of Ctrl, srGAP1 KD #1, and srGAP1 KD #2 MDA-MB-231 cells using AFM. n = 100 (Ctrl), 200 (KD #1), and 200 (KD #2) measurements over 4, 8, and 8 cells, respectively. Mann-Whitney U test, two-tailed. Data represented as a box and whisker plot, with median and interquartile range in the box and min and max as whiskers.