
Fig. 6
- ID
- ZDB-FIG-220922-51
- Publication
- Mondal et al., 2022 - A proliferative to invasive switch is mediated by srGAP1 downregulation through the activation of TGF-β2 signaling
- Other Figures
- All Figure Page
- Back to All Figure Page
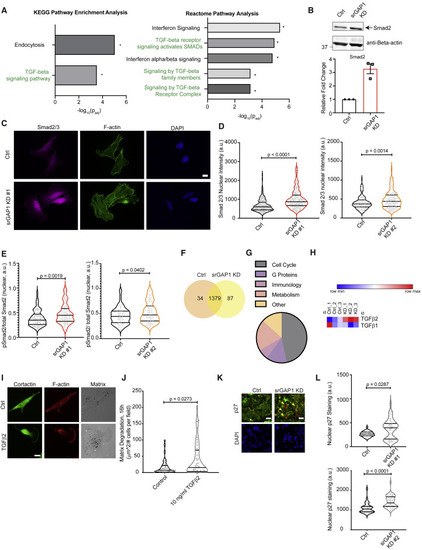
Figure 6. srGAP1low cells have increased Smad2 activation and TGF-β2 secretion (A) Left: KEGG pathway enrichment analysis; right: reactome pathway analysis of differentially expressed genes in srGAP1 KD #1 MDA-MB-231 tumors in relation to Ctrl tumors, ∗padj < 0.05. (B) Top: immunoblot of Smad2 in Ctrl and srGAP1 KD #1 MDA-MB-231 cells using an anti-Smad2/3 antibody. Loading control, anti-β-actin. Bottom: densitometry analysis of Smad2 protein levels in Ctrl and KD #1 cells, three biological replicates. (C) Immunofluorescence of Smad2/3 in Ctrl and srGAP1 KD #1 MDA-MB-231 cells. Left: Smad2/3. Middle: phalloidin staining for F-actin. Right: DAPI for nuclear staining. Scale bar, 10 μm. (D) Smad2/3 nuclear intensity per cell. Left: n = 170 (Ctrl), 171 (srGAP1 KD #1) MDA-MB-231 cells. Right: n = 151 (Ctrl) cells, n = 169 (srGAP1 KD #2) MDA-MB-231 cells. Data over three independent experiments, Mann-Whitney U test, two-tailed. Data represented as a violin plot; horizontal lines are median and interquartile range. (E) pSmad2/total Smad2 nuclear intensity ratio. Left: n = 90 (Ctrl), 94 (srGAP1 KD #1) MDA-MB-231 cells. Right: n = 80 (Ctrl), 99 (srGAP1 KD #2) MDA-MB-231 cells. Data over three independent experiments, Mann-Whitney U test, two-tailed. Data represented as a violin plot; horizontal lines are median and interquartile range. (F) Differential expression of proteins from secretome analysis of conditioned medium from srGAP1 KD #1 MDA-MB-231 cells in relation to conditioned medium from Ctrl cells. Data visualized as a Venn diagram, three biological replicates and two technical duplicates. (G) Pathway enrichment analysis of secretome (proteomics of conditioned medium) from srGAP1 KD #1 MDA-MB-231 cells in relation to conditioned medium from Ctrl cells. (H) Expression of TGF-β ligands from proteomics data comparing conditioned medium from Ctrl and srGAP1 KD #1 MDA-MB-231 cells. Each data point is a biological replicate (averaged technical duplicates). (I) Matrix degradation of MDA-MB-231 Ctrl cells plated on gelatin and stimulated with 10 ng/mL TGF-β2, 16 h. Left: cortactin. Middle: phalloidin stain for F-actin. Right: fluorescent gelatin matrix. Scale bar, 10 μm. (J) Matrix degradation of MDA-MB-231 Ctrl cells stimulated with 10 ng/mL TGF-β2 plated on gelatin, 16 h. Data from three independent experiments and represented as a violin plot, horizontal lines are median and interquartile range. n = 41 (Ctrl), 42 (TGF-β2-stimulated) fields quantified. Mann-Whitney U test, two-tailed. (K) Nuclear p27 staining intensity of MDA-MB-231 Ctrl and srGAP1 KD #2 primary tumors. Top: p27. Bottom: DAPI for nuclei. Scale bar, 10 μm. (L) Nuclear p27 staining intensity of MDA-MB-231 primary tumors. Top: data pooled over two Ctrl and two srGAP1 KD #1 mice. n = 39 (Ctrl) cells, n = 48 (srGAP1 KD #1) cells. Two 246 × 246 μm sections quantified per mouse. Mann-Whitney U test, two-tailed. Bottom: data pooled over two Ctrl and two srGAP1 KD #2 mice. One 388 × 388 μm section quantified per mouse. n = 38 (Ctrl) cells, n = 46 (srGAP1 KD #2) cells. Mann-Whitney U test, two-tailed. Data represented as a violin plot; horizontal lines are median and interquartile range. |