
- Title
-
WRN promotes bone development and growth by unwinding SHOX-G-quadruplexes via its helicase activity in Werner Syndrome
- Authors
- Tian, Y., Wang, W., Lautrup, S., Zhao, H., Li, X., Law, P.W.N., Dinh, N.D., Fang, E.F., Cheung, H.H., Chan, W.Y.
- Source
- Full text @ Nat. Commun.

The wrn mutant zebrafish exhibit shortened body length.
a Representative bright-field images of 3 independent experiments between WT and wrn−/− mutant zebrafish at 40 hpf. Scale bar = 100 µm. b Dot graph analysis of the total body length of WT and wrn−/− mutants from 4 dpf to 14 dpf. N = 25 independent embryos for WT and wrn−/− mutants, respectively. Each dot represents a biological replicate. c–f Representative calcein green staining of 3 independent experiments to examine bone formation between WT and wrn−/− mutant zebrafish from 3 dpf to 14 dpf. White arrows indicate vertebrate regions. Scale bar = 100 µm. Data are presented as the mean ± S.D. Statistical analysis was performed using two-tailed unpaired Student’s t-test. *P < 0.05, **P < 0.01, ***P < 0.001. PHENOTYPE:
|
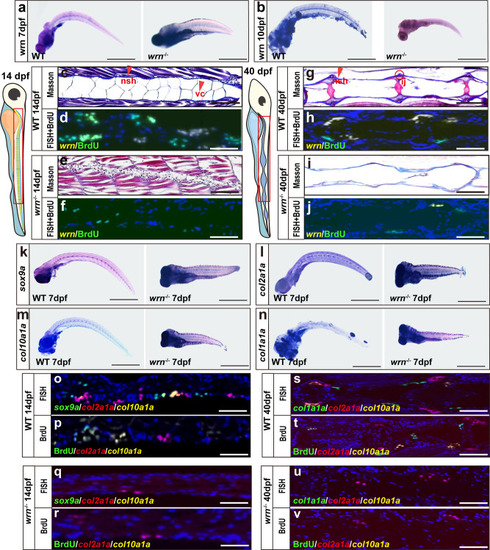
Loss of wrn causes bone abnormalities in zebrafish.
a, b Representative WISH analysis of 3 independent experiments of wrn expression between WT and wrn−/− mutant zebrafish on both 7 dpf and 10 dpf. c, e, g, i Representative Masson’s trichrome staining of 3 independent experiments between WT and wrn−/− mutant zebrafish on 14 dpf (c WT; e wrn−/− mutants) and 40 dpf (g WT; i, wrn−/− mutants). Scale bar = 100 µm. Notochord sheath (nsh, red arrow indicated) and notochord vaculated cells (vc, red arrow indicated). Intercentral joint (ij, red encircled) and centrum (ct). d, h, f, j Representative FISH analysis of 3 independent experiments of wrn expression and BrdU staining between WT and wrn−/− mutant zebrafish on 14 dpf (d WT; f wrn−/− mutants) and 40 dpf (h WT; j wrn−/− mutants). k–n Representative WISH analysis of 3 independent experiments of chondrogenic markers (sox9a, col2a1a, col10a1a, and col1a1a) between WT and wrn−/− mutant zebrafish on 7 dpf. Scale bar = 50 µm. o–v Representative FISH analysis combined with BrdU staining of 3 independent experiments of chondrogenic markers (sox9a, col2a1a, and col10a1a) between WT and wrn−/− mutant zebrafish on 14 dpf (o, p WT; q, r wrn−/− mutants) and chondrogenic markers (col2a1a, col10a1a, and col1a1a) on 40 dpf (s, t WT; u, v wrn−/− mutants). Scale bar = 100 µm. EXPRESSION / LABELING:
PHENOTYPE:
|
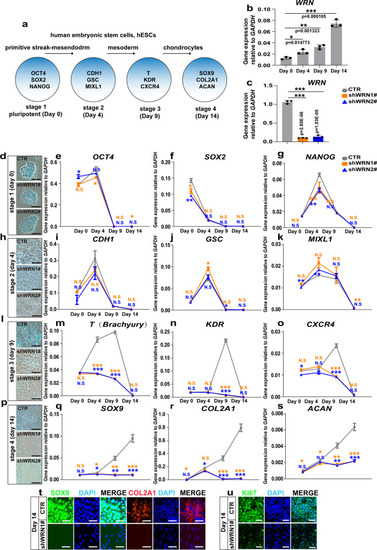
WRN deficiency impairs cartilage development in vitro.
a Illustration of hESCs differentiation model. b qRT-PCR measurement of WRN expression profile during chondrogenesis in hESCs. N = 3 independent biological experiments. c. qRT-PCR measurement of WRN-KD efficiency. N = 3 independent biological experiments. d, h, l, p Representative alcian blue staining of 3 independent experiments to examine the formation of chondrocyte on day 0 (d), day 4 (h), day 9 (l), and day 14 (p) between CTR and two KD-WRN groups. Scale bar = 20 µm. e–g qRT-PCR measurement of genes (NANOG, OCT4, and SOX2) related to hESC pluripotency stage. N = 3 independent biological experiments. i–k qRT-PCR measurement of genes (MIXL1, GSC, and CDH1) related to the primitive streak-mesendodermal stage. N = 3 independent biological experiments. m–o. qRT-PCR measurement of genes (T, KDR, and CXCR4) related to the mesodermal stage. N = 3 independent biological experiments. q–s qRT-PCR measurement of genes (SOX9, COL2A1, and ACAN) related to chondrocytes. N = 3 independent biological experiments. t Representative immunofluorescent staining of 3 independent experiments between the CTR and KD-WRN groups on day 14 in hESCs. SOX9 and COL2A1 were examined. Scale bar = 50 µm. u Representative images of immunofluorescent staining of 3 independent experiments between the CTR and KD-WRN groups on day 14 in hESCs. Ki67 was examined. Scale bar = 20 µm. Data are presented as the mean ± S.D. Statistical analysis was performed using two-tailed unpaired Student’s t-test. *P < 0.05, **P < 0.01, ***P < 0.001. |
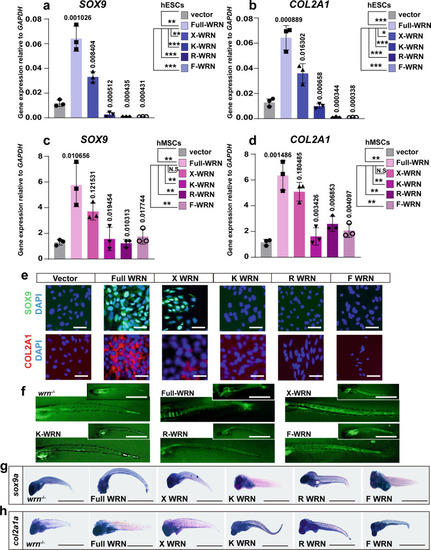
WRN helicase is essential for chondrogenesis.
a–d. qRT-PCR measurement of different WRN expressions on day 14 in hESCs (a, b) and hMSCs (c, d). (Vector, full-length WRN, X-WRN (E84A), K-WRN (K57M), R-WRN (R993A), F-WRN (F1037A)). N = 3 biological independent experiments. Data are presented as the mean ± S.D. Statistical analysis was performed using two-tailed unpaired Student’s t-test. *P < 0.05, **P < 0.01, ***P < 0.001. e Representative immunofluorescent staining of 3 independent experiments between the CTR and KD-WRN group on day 14 in hESCs. SOX9 and COL2A1 were examined. Scale bar = 50 µm. f Representative calcein staining of three independent experiments to examine the bone formation after microinjection of different human WRN mRNA in one-cell stage and checked at 7 dpf. Scale bar = 100 µm. g, h Representative WISH analysis of 3 independent experiments to examine the expression of sox9a and col2a1a after microinjection of different human WRN mRNA in one-cell stage and checked on 7 dpf. Scale bar = 50 µm. |
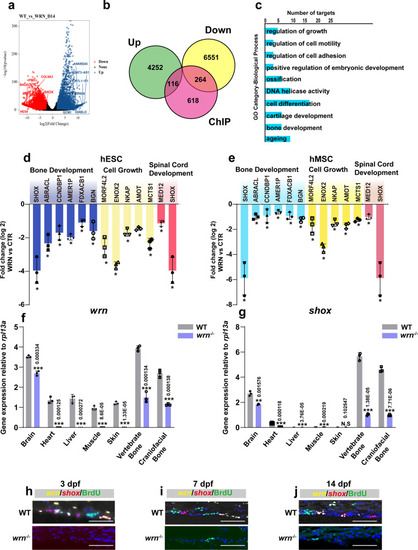
Integrative analysis of RNA-seq and ChIP-seq in chondrogenesis.
a Volcano plot was depicted with the fold change on day 14. P values were calculated by empirical Bayes moderated t test in limma combined with Benjamini–Hochberg method adjustment. Genes with an adjusted p-value of ≤ 0.05 and |log2 fold change | > 0.5 were considered as significantly changed. Top upregulated genes (blue) and downregulated changed genes (red) were shown. b The overlay of RNA-seq and ChIP-seq analysis showed the genes were potential direct targets of WRN in chondrogenic homeostasis. c GO functional clustering of genes that were for identification of biological processes directly regulated by WRN. Representative downregulated categories were shown. d, e qRT-PCR validation analysis showed the mRNA expression fold change among bone development, cell growth, and spinal cord development-associated genes in the CTR vs WRN-KD chondrocytes in the hESCs (g) and hMSCs (h) on day 14. N = 3 independent biological experiments. The error bar represents the standard deviation (s.d.) and P-value was generated by using one-way ANOVA with the Tukey’s post hoc test. f, g qRT-PCR measurement of the expression of wrn and shox in different tissue in WT and wrn−/− mutant zebrafish at 40 dpf. N = 3 independent biological experiments. Data are presented as the mean ± S.D. Statistical analysis was performed using two-tailed unpaired Student’s t-test. h–j Representative FISH analysis of three independent experiments of wrn and shox in WT zebrafish and wrn−/− mutant zebrafish at 3 dpf, 7 dpf, and 14 dpf. Scale bar = 100 µm. *P < 0.05, **P < 0.01, ***P < 0.001. EXPRESSION / LABELING:
PHENOTYPE:
|
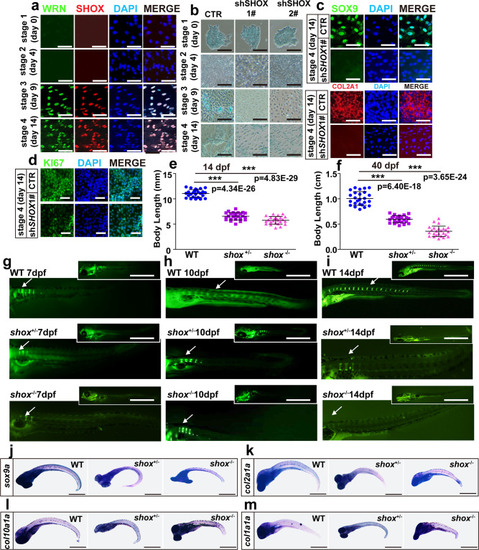
SHOX is a crucial regulator in WS bone development.
a Representative immunofluorescent staining of 3 independent experiments in CTR-hESCs with four sequential time points. WRN and SHOX were examined. Scale bar = 50 µm. b Representative alcian blue staining of 3 independent experiments between CTR and two KD-SHOX groups. Scale bar = 20 µm. c Representative immunofluorescent staining of 3 independent experiments between CTR and shSHOX1# groups on day 14 in hESCs. SOX9 and COL2A1 were examined. Scale bar = 50 µm. d Representative immunofluorescent staining of 3 independent experiments between CTR and shSHOX1# groups on day 14 in hESCs. Ki67 was examined. Scale bar = 20 µm. e, f Dot graph analysis of the total body length among WT, shox+/-, and shox−/− mutants on 14 dpf (e) and 40 dpf (f). Each dot represents a biological replicate. N = 25 independent embryos for WT, shox+/-, and shox−/− mutants, respectively. Three independent biological experiments were performed. Data are presented as the mean ± S.D. g–i Representative calcein staining of 3 independent experiments among WT, shox+/-, and shox−/− mutants from 7 dpf to 14 dpf. White arrows indicate vertebrate regions. Scale bar = 100 µm. j–m Representative WISH analysis of 3 independent experiments of chondrogenic markers (sox9a, col2a1a, col10a1a, and col1a1a) on 7 dpf. Scale bar = 50 µm. Statistical analysis was performed using two-tailed unpaired Student’s t-test. *P < 0.05, **P < 0.01, ***P < 0.001. EXPRESSION / LABELING:
PHENOTYPE:
|

SHOX restores chondrogenesis in WS.
a, b, d, e qRT-PCR measurement of the expression of SOX9 and COL2A1 among CTR, shWRN1#, and rescue groups during chondrogenesis on day 14 in hESCs and hMSCs. N = 3 independent biological experiments. c, f Representative immunofluorescent staining of 3 independent experiments among CTR, shWRN1#, and rescue groups on day 14 in hESCs and hMSCs. SOX9 and COL2A1 were examined. Scale bar = 50 µm. g, i Dot graph analysis of the total body length among WT, wrn−/− mutant, and rescue groups on 14 dpf (h) and 21 dpf (i). N = 25 independent zebrafish embryos for WT, wrn−/− mutant, and rescue groups, respectively. Each dot represents a biological replicate. h, j Representative bright-field images of 3 independent experiments among WT, wrn−/− mutant, and rescue groups on 14 dpf (h) and 21 dpf (j). Scale bar = 100 µm. k, r qRT-PCR measurement of genes (sox9a, col2a1a, and col10a1a) on 14 dpf (k) and 21 dpf (r). N = 3 independent biological experiments. l–q and s–x Representative FISH and BrdU analysis of 3 independent experiments of chondrogenic markers (sox9a, col2a1a, and col10a1a) on 14 dpf (l–q) and 21 dpf (s–x). Scale bar = 100 µm. Data are presented as the mean ± S.D. Statistical analysis was performed using two-tailed unpaired Student’s t-test. *P < 0.05, **P < 0.01, ***P < 0.001. EXPRESSION / LABELING:
PHENOTYPE:
|
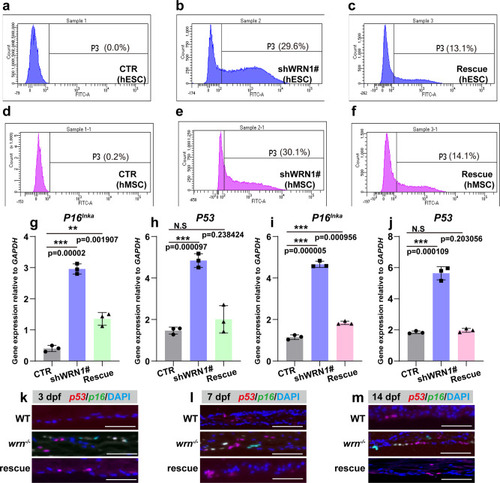
SHOX/shox prevents chondrocyte senescence in WS models.
a–f Representative flow cytometry plots of three independent biological experiments for senescent analysis among CTR, shWRN1#, and rescue groups in hESC (a–c) and hMSC (d–f). g–j qRT-PCR measurement of P53 and P16Ink4a in CTR, shWRN1#, and rescue groups in hESC (g–h) and hMSC (i–j) on day 14. N = 3 independent biological experiments. k–m Representative FISH analysis of 3 independent experiments of p53 and p16 in WT, wrn−/− mutant, and rescue groups on 3 dpf, 7 dpf, and 14 dpf. Scale bar = 50 µm. Data are presented as the mean ± S.D. Statistical analysis was performed using two-tailed unpaired Student’s t-test. *P < 0.05, **P < 0.01, ***P < 0.001. EXPRESSION / LABELING:
PHENOTYPE:
|
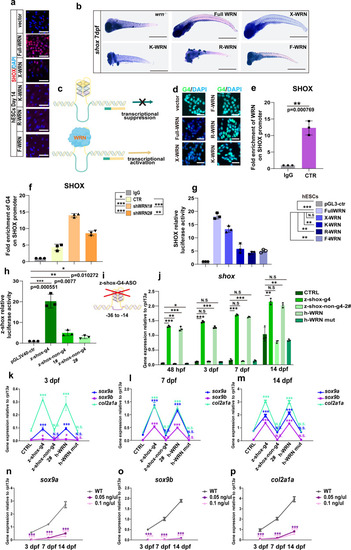
WRN helicase unwinds SHOX G-quadruplexes.
a Representative immunofluorescent staining of 3 independent experiments with different WRN mutant plasmids in hESCs on day 14. SHOX was examined. Scale bar = 50 µm. b Representative WISH analysis of 3 independent experiments of the expression of shox on 14 dpf. Scale bar = 50 µm. c Illustration of the mechanism of WRN in opening G-quadruplex. d Representative immunofluorescent images of 3 independent experiments with different WRN mutant plasmids in hESCs on day 14. G4 was examined. Scale bar = 50 µm. e Fold enrichment of WRN on SHOX promoter using ChIP-qPCR analysis. N = 3 independent biological experiments. f Fold enrichment of G4 on SHOX promoter using ChIP-qPCR analysis. N = 3 independent biological experiments. g Luciferase assay of the human SHOX transcription activity. h Luciferase assay of the zebrafish shox transcription activity. i Illustration of zebrafish shox-G4 anti-sense oligonucleotides design. j qRT-PCR measurement of shox. N = 3 independent biological experiments. k–m qRT-PCR measurement of sox9a, sox9b, and col2a1a at 3 dpf (k), 7 dpf (l), and 14 dpf (m). N = 3 independent biological experiments. n–p qRT-PCR measurement of sox9a (n), sox9b (o), and col2a1a (p) at different time points. N = 3 independent biological experiments. Data are presented as the mean ± S.D. Statistical analysis was performed using two-tailed unpaired Student’s t-test. *P < 0.05, **P < 0.01, ***P < 0.001. EXPRESSION / LABELING:
PHENOTYPE:
|